QSO Today Ham Expo 2020 HamSCI Links
HamSCI Links
- HamSCI
- HamSCI Personal Space Weather Station
- HamSCI Get Involved
- TAPR TangerineSDR
- June 2020 Eclipse Festival of Frequency
- December 2020 Eclipse Festival Sign-Up
Alternate Language Options:
Spanish: Español
Portuguese: Portugués
Kristina Collins: [email protected]
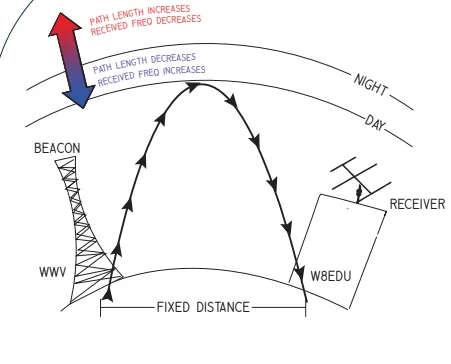
There are multiple time standard stations which can be heard in South America. The Brazilian station PPE (10 MHz) will be the primary beacon for this experiment. You may also pick up signals from the Venezuelan station YVTO (5 MHz), the Argentinian station LOL (10 MHz), WWV, WWVH and BPM. This experiment will use only the 10 MHz transmissions. If you can't get a good signal on 10 MHz, record another frequency and make sure the file is labeled appropriately. The recordings in this experiment are expected to show formations of the D-layer at stations' local sunrise and other daily events of the ionosphere, and the effects of the eclipse. Space weather varies day to day and some features may be prominent. We'll see what we get!
Fill out the survey here to sign up for the email list. You will receive occasional updates and reminders.
We will be advising most participants to use an 8kHz sampling rate in the section below. If your radio is relatively new (manufactured after the year 2000 or so) that should be just fine. If you're running an older radio, however, your filters may not have a sharp enough cutoff. (You can see this process in a video here.) To check the filter bandwidth on your receiver:

IMPORTANT: If you have multiple radios collecting data simultaneously under a single callsign, add a hyphen and station number for each station wherever you would otherwise use the callsign. For example, if station W8EDU is running data collection simultaneously on a Flex radio and an Icom radio, they should label one as W8EDU-1 and the other as W8EDU-2, include a comment in the metadata for each station explaining that the operator ran multiple stations, and make sure that the metadata is correct and complete. This will make it much easier to sort through the data from the experiment during the analysis phase.


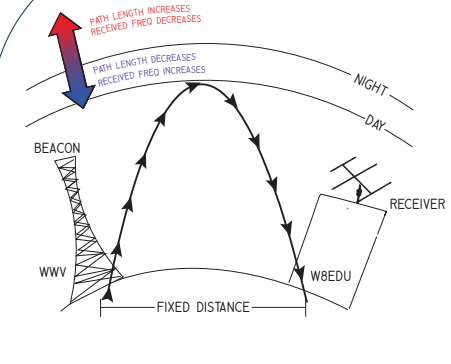
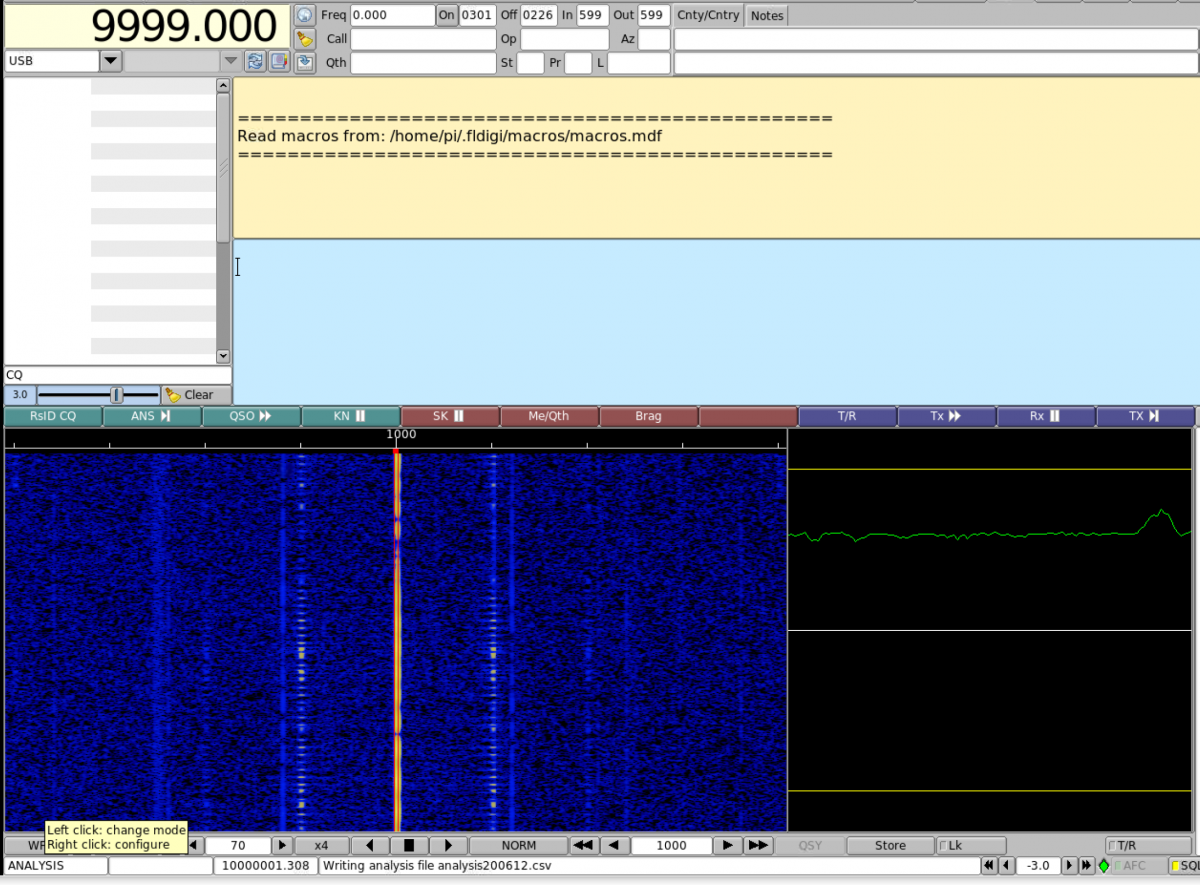
Once you're all set, your setup should look something like this:
The data collection runs from 9 to 16 December. There will also be two practice runs: November 15th and December 5th. During this time, leave your radio running, check it periodically and make sure your computer is not shut down by an automatic update.
We strongly recommend recording a few days' worth of test data before the experiment begins in order to ensure that you don't run into computer problems. After completion but before uploading, select the file/directory to be uploaded, right click on it, and select Send to compressed (zipped) folder. This is what you should upload.
If you would like to include documentation of your station, notes on observations, photos of the experiment or eclipse, etc., please include these in the zipped folder with your data. Unless you note otherwise, we may use your photos, with attribution, in future HamSCI materials.
Fill out the data collection survey here. (This is only necessary for the main data run, not the practice runs.)
Upload your at this link: https://cwru.app.box.com/f/d707e6414087462399f3601a2a4e0ca0
You can upload as many files as necessary, but each individual file should not be larger than 15 GB. Compressing your files may help reduce your upload speed. Note that wav files will usually only shrink to about 80% of their original size. You should NOT use mp3 or wma compression, because these formats can compromise amplitude and frequency characteristics.
Frequently Asked Questions

https://www.ce3aa.cl/el-festival-eclipse-de-medicion-de-frecuencia-de-diciembre-2020/
https://cqnewsroom.blogspot.com/2020/11/volunteers-needed-for-propagation.html
https://www.arnewsline.org/news/2020/11/19/amateur-radio-newsline-report-2247-for-friday-november-20th-2020
https://www.spreaker.com/user/hamtalklive/episode-237-q-a-with-rob-sherwood-nc0b-a
http://www.arrl.org/contest-update-issues?issue=2020-11-25
https://youtu.be/YX-vTKt1LGk?t=1626
https://hackaday.com/2020/11/30/gathering-eclipse-data-via-ham-radio/
Lunchtime Livestream for December 2 - Ham Radio Livestream - YouTube
Thanks to Matt KE8NZR for Spanish translation and Noilson Caio - Darkwaves group for Portuguese translation.
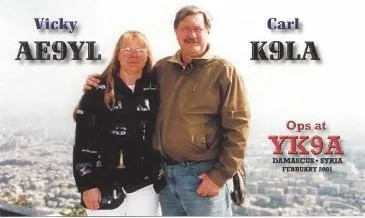
By Carl Luetzelschwab K9LA
Editor's Note: Carl K9LA is a long-time amateur radio operator, DXer, electrical engineer, writer, and HamSCI member. He curates a tremendous amount of propagation and radio science information at his website, k9la.us. We have asked Carl to give us a brief tour of some of his favorite parts of his website.
If you’ve come to https://k9la.us because of your interest in propagation, the following is a mini-guided tour to help you navigate to the material you’re interested in.
The home page gives a basic introduction, and new items and relevant old items are listed here (usually at the beginning of each month). On the left side of the home page are links that contain material specific to certain aspects of propagation in our Amateur Radio hobby.
The Monthly Feature link offers articles about a myriad of topics. These topics are often tied to observations of ionospheric propagation and measurements of solar and ionospheric data. Some important topics that have been covered are the new sunspot numbers (the April 2016 document), the ongoing study of gravity waves and travelling ionospheric disturbances (the March 2020 document) and a look at propagation on our 630-meter and 2200-meter bands (the December 2018 document). As a side note, many HamSCI participants are involved in the gravity wave/TIDs studies.
The Timely Topics link has articles tied to recent happenings. It includes a plot of the latest smoothed sunspot number during the ongoing solar minimum period compared to previous solar minimum periods, and a plot of Cycle 24 and Cycle 25 sunspots as we progress through the solar minimum period between Cycles 24 and 25.
The Basic Concepts link highlights topics that provide a better understanding of several fundamental issues in propagation. Two such articles that are tied to propagation predictions are the correlation between solar flux and sunspot number, and the correlation between MUF and solar flux.
The Tutorials link provides information on how to set up, run and interpret propagation predictions with two free propagation prediction programs – VOACAP and W6ELProp.
The General link includes topics that are common to our MF and HF bands. Included are four of the five books that Bob NM7M (SK) wrote: Long-Path Propagation (1992 – a year-long study of long path on the 20-meter band from Anacortes, Washington to Europe and Africa), The Little Pistol’s Guide to HF Propagation (1996 – an intermediate level text about solar issues and propagation), Long-Path Propagation Revisited in Year 2000 (2000 – a broader look at long path, including processes affecting the 160-meter band) and On Ion Chemistry and Propagation (2002 – unpublished – a look about the very complicated chemical processes in the ionosphere). Also included in this link are articles on why our propagation predictions use a monthly median model of the ionosphere and not a daily model (the Day-to-Day Variability of the Ionosphere document), an article about two important magnetic field parameters (the Where Do the K and A Indices Come From document) and an article about high latitude propagation (the A Look Inside the Auroral Oval document).
The next three links are tied to specific issues for 160m, HF and VHF propagation. The 160m link has NM7M’s fifth book – The Big Gun’s Guide to Low-Band Propagation (2002 – a detailed look at propagation on the 160-meter band) and discussions about ducting, spotlight propagation and skewed paths on topband.
The HF link includes articles on propagation on our HF bands (many 10-meter articles and a discussion of an ionosphere-ionosphere mode on 20-meters).
The VHF link focuses on 6-meter propagation. Included in this link is an in-depth study on trans-equatorial propagation (common to our 6-meter and 10-meter bands).
The last link for propagation issues is the Contesting link. These are articles for contesting aficionados, and include using trees for low band wire antennas, the effect of solar flares on contest operations and the effect of CMEs on contest operations.
In summary, I hope there is something for everyone on my website with respect to LF, MF, HF and VHF propagation and solar topics. If not, let me know at [email protected].
This page is an archive of updates pertaining to the June 2020 Eclipse Festival.
________________________________________________________________________________
0000 18 June UTC: 48h before start
Kristina Collins is inviting you to a scheduled Zoom meeting.
Topic: Eclipse Festival Debugging
Time: Jun 18, 2020 03:00 PM Eastern Time (US and Canada)
Join Zoom Meeting
https://cwru.zoom.us/j/99281681544?pwd=dlI0TzdrbVBCTGVvUWUxci9aaW0xUT09
Meeting ID: 992 8168 1544
Password: Kenneth
One tap mobile
+13017158592,,99281681544# US (Germantown)
+13126266799,,99281681544# US (Chicago)
Dial by your location
+1 301 715 8592 US (Germantown)
+1 312 626 6799 US (Chicago)
+1 646 558 8656 US (New York)
+1 253 215 8782 US (Tacoma)
+1 346 248 7799 US (Houston)
+1 669 900 6833 US (San Jose)
Meeting ID: 992 8168 1544
Find your local number: https://cwru.zoom.us/u/aPQVnrAgp
Join by SIP
[email protected]
Join by H.323
162.255.37.11 (US West)
162.255.36.11 (US East)
221.122.88.195 (China)
115.114.131.7 (India Mumbai)
115.114.115.7 (India Hyderabad)
213.19.144.110 (EMEA)
103.122.166.55 (Australia)
209.9.211.110 (Hong Kong SAR)
64.211.144.160 (Brazil)
69.174.57.160 (Canada)
207.226.132.110 (Japan)
Meeting ID: 992 8168 1544
Password: 511904
Join by Skype for Business
https://cwru.zoom.us/skype/99281681544
_________________________________________________________________________________
0000 UTC 19 June 2020: 24 hours before start
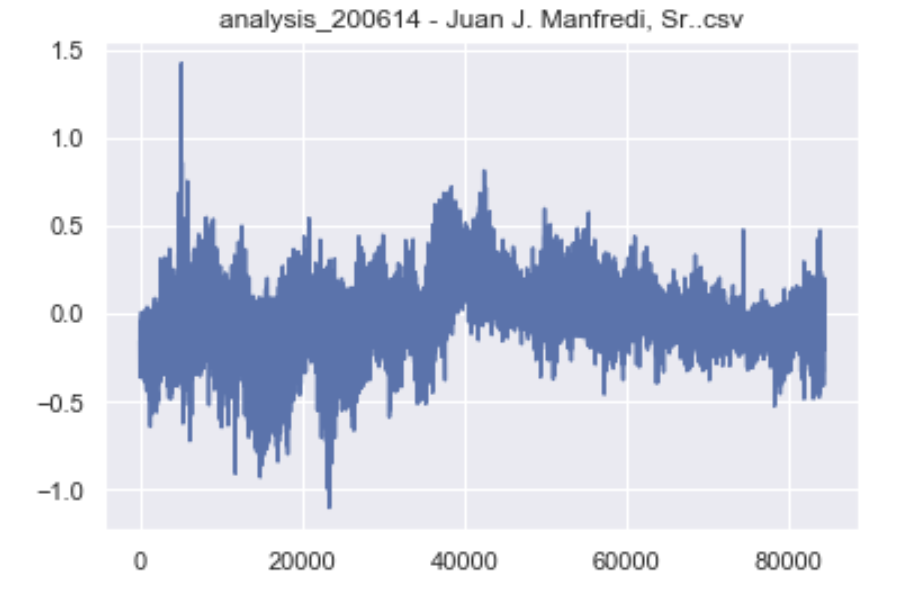
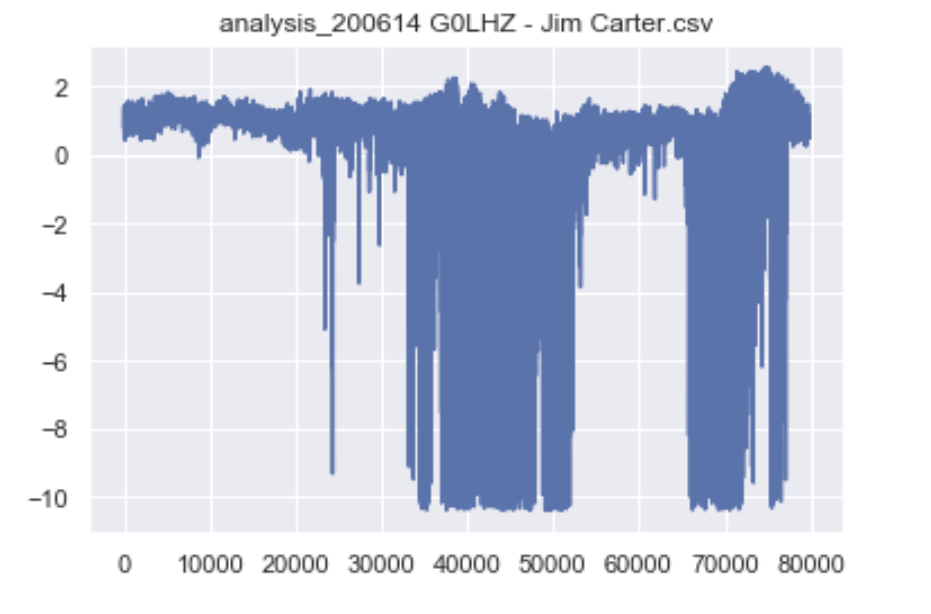
Gentlemen, start your radios. (Temperature stability is important for frequency stability. If you don't believe me, check out the attached spectrogram from Franck F4IEW, taken as his radio was warming up.)
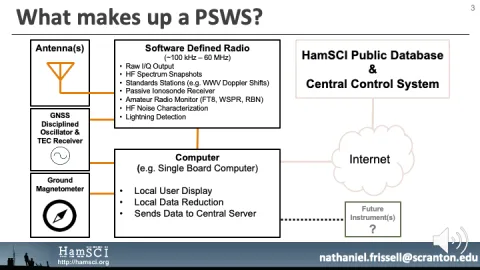
Personal Space Weather Station
/psws-overview
Vestibulum ante ipsum primis in faucibus orci luctus et ultrices posuere cubilia Curae; Sed aliquam, nisi quis porttitor congue, elit erat euismod orci, ac placerat dolor lectus quis orci. Etiam sit amet orci eget eros faucibus tincidunt. Praesent congue erat at massa. Fusce vel dui.
Suspendisse enim turpis, dictum sed, iaculis a, condimentum nec, nisi. Donec mollis hendrerit risus. Morbi vestibulum volutpat enim. Praesent nec nisl a purus blandit viverra.
Llamado a todas las radioaficionados en el hemisferio oriental. Nos unimos para
20 de Junio 2020 a 22 de Junio 2359 UTC
Los cambios en la densidad de electrones ionosférico causado por el clima espacial y los cambios diurnos del sol pueden causar desplazamientos Doppler en los trayectos de propagación HF. Por ejemplo, vea la figura 7 en Boitman Et al.,1999. El primer intento a medir eses desplazamientos Doppler de HamSCI fue durante el eclipse solar total en Agosto 2017. Planeamos medidas cuidadosas durante el eclipse total de 2024. Como parte del centenario de WWV, 50 radioaficionados recogido datos sobre los desplazamientos Doppler para Festival de Medición de Frecuencia, demostrando el valor de la recolección voluntaria de datos. Este Junio, solicitamos que todas las radioaficionados, radioescuchas de onda corta, y otras que pueden medir las frecuencias HF con precisión ayúdanos a recoger datos de la frecuencia para el eclipse anular en el 21 de Junio.
Kristina Collins: [email protected]
¿Cómo varían los caminos de propagación de los estaciones de tiempo de onda corta estándar durante un día completo de calendario?
¿Qué propiedades del ionosfera podemos medir observando los cambios en los caminos de propagación HF?
¿Que efecto va a tener el eclipse anular en estos caminos de propagación?
¿Cómo se comparan técnicas de medir diferentes para comprender los caminos de propagación?
¿Hay interesa voluntario a recoger datos cerca al camino de la totalidad de este eclipse?
Objetivos
Promover la buena voluntad internacional trabajando con científicos amateur desde el mundo
Medir los desplazamientos Doppler causado por el clima espacial en la ionosfera
Utilizar un protocolo de medida specifico disponible a las radioaficionados y otros científicos amateur
Día de control: 14 de Junio 2020, 0000-2359 UTC
Recopilación de datos empeza al 20 de Junio 2020, 0000 UTC
Recopilación de datos termina al 22 de Junio 2020, 2359 UTC
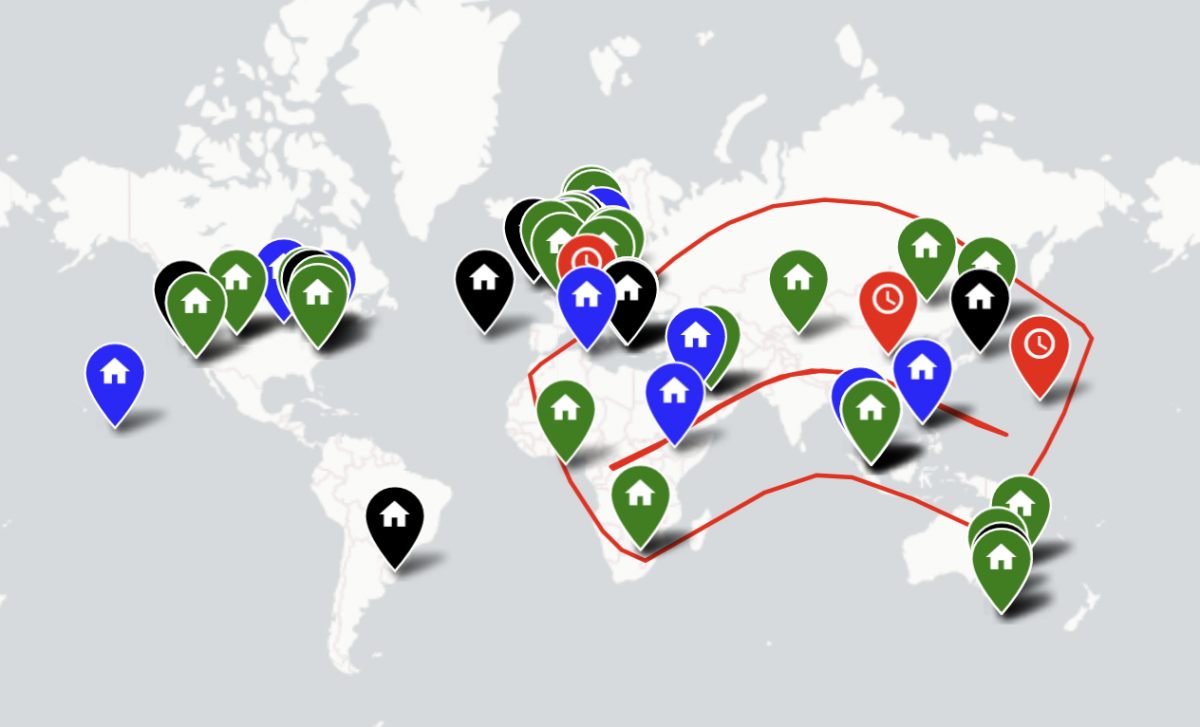
La radiobaliza será BPM, la estación de servicio de tiempo en la Academia China de Ciencias, marcada con el punto azul en el mapa de arriba. BPM transmite en 2.5, 5, 10, y 15 MHz. Para este experimento, solo usaremos las transmisiones de 10 MHz. Sí quiere participar pero no puede grabar 10 MHz, use la frecuencia que puedes grabar y etiqueta su archivo apropiadamente. Las grabaciones en este experimento muestren formaciones de la capa D al amanecer local de las estaciones y otros eventos diarios de la ionosfera y los efectos del eclipse. El clima espacial varía día a día y algunas características pueden ser prominentes. ¡Vamos a ver lo que obtenemos!
Complete la encuesta aquí para inscribirse.
Utiliza tu receptor más estable. Sí tiene un GPSDO o otro estándar de frecuencia de precisión, usarlo. Usa una buena tarjeta de sonido (la que está dentro de su receptor si está equipada). Le solicitamos específicamente que utilice el paquete de software de código abierto fldigi-4.1.12 o posterior. Su modo de "análisis de frecuencia" genera archivos diarios de desviaciones de frecuencia, llamados automáticamente "análisis_(fecha).csv". Estará en el directorio /fldigi / temp/, o .fldigi / temp/, o algún equivalente. Usted debe utilizar una versión reciente de fldigi, o sus datos serán sobrescritos.
Descarga fldigi , instálalo, verifica que esté funcionando correctamente.
Para cambiar la idioma, va a “Configure” >>”Config Dialog” luego, en el lado izquierdo de la ventana emergente, haga clic en”UI” >> “General” y cambiar el idioma en el menú “UI Language” y haga clic en “Save”. Reinicie el programa para que los cambios surtan efecto
Busque el módulo "Freq Analysis" en el menú desplegable "modos".
Sintonice su radio (en modo AM) a BPM en 10 MHz
Establezca el modo de su receptor en USB (banda lateral superior). Para BPM de 10 MHz, sintonice a 9.999 MHz y escuche el tono de 1000 Hz.
En fldigi, asegúrese de que la frecuencia sintonizada en la esquina superior izquierda sea la misma que la frecuencia de su radio. Para cambiarlo, haga clic en la mitad superior de un dígito para aumentarlo o en la mitad inferior para disminuirlo.
Busque la línea de 1000 Hz en la cascada de fldigi. Haga clic en el cursor allí o use el cuadro de frecuencia de desplazamiento en la parte inferior de la ventana de fldigi. Debe establecer el número en el cuadro en la parte inferior de la ventana exactamente a 1000.
En fldigi, seleccione el menú "Modos" y seleccione el modo "Freq Analysis"
Busque "escribir archivo CSV" en la línea inferior de fldigi, hacia la izquierda.
Si ve múltiples operadores, se necesita información Doppler más detallada. Vaya a Archivo> Audio> Capturar RX para grabar su señal de audio. Guarde su archivo con la marca de tiempo UNIX actual y su indicativo o nombre, p. "1592282573 - W8EDU.wav". La grabación continua durante 3 días dará como resultado un archivo de 4,5 GB, por lo que es posible que desee pausar y reiniciar este proceso ocasionalmente para asegurarse de que su computadora no se quede sin espacio y se bloquee. Para reiniciar el proceso, desactive la casilla en Archivo> Audio> Capturar RX y luego vuelva a marcarlo. Se le pedirá que guarde un nuevo archivo; recuerde usar la marca de tiempo actual para que podamos realizar un seguimiento.
Ahora, deja a fldigi solo.
Al final de su período de grabación, cierre fldigi. El archivo "analysis.csv" debe estar en su directorio / fldigi / temp /.
Pruebe todo esto antes del día del evento.
Comience el Paso 1 anterior al comienzo de su período de recopilación de datos. Habrá una día de práctica en el 14 de junio y la recopilación de datos principal ocurrirá al 20 de junio, 0000 UTC a 2359 UTC el 22 de junio.
Durante este tiempo, deje su radio sola y asegúrese de que su computadora no esté apegada por una actualización automática.
Al final del período de recopilación de datos, debe tener tres archivos “*.csv”, uno para cada día de recopilación de datos..
Subir sus datos al formulario de Google aquí: https://forms.gle/W6grP4cVpGgY2eVD7
Este formulario se utiliza para los datos práctica y los datos finales. Por favor, no edite los archivos.
Preguntas Frecuentes
P: ¿Para qué se utilizarán estos datos?
R: Esta información será analizada por miembros de la organización HamSCI. Los datos y resultados se harán públicos, como lo hicimos para el Festival original de Medición de Frecuencia .
P: No estoy en el camino de la totalidad. ¿Todavía puedo participar?
R: Por supuesto, sí. Si está muy lejo del camino de la totalidad, no podemos garantizar que podemos usar sus datos, pero siempre es bueno practicar y es posible que nos interese trabajar con usted en el futuro.
P: Me perdí la día de control en el 14 de junio. ¿Todavía puedo participar?
R:¡Por supuesto, sí! Contactarnos en el enlace de arriba.
P: Si tengo problemas para que fldigi trabaje, ¿me pueden ayudar?
R: Sí, Envíenos un correo electrónico a [email protected] y podemos assistir a configurar su radio.
P:¿Puedo usar una programa otra como fldigi para hacer mediciones Doppler?
R: Sí, pero no podemos asistir con programas que no son fldigi.
P: ¿Puedo grabar otra estación estándar de tiempo que no sea BPM?
R: Sí, aunque no podemos prometer que podemos usar sus datos. Puede encontrar una lista de estaciones estándar de tiempo internacionales aquí.
P: ¿Puedes usar mis datos si no puedo grabar para el periodo completo?
R: Más datos es mejor que menos, pero si necesita usar su radio durante el el evento para dos o tres horas, todavía tenemos interesa entre sus datos. Solo asegúrate de salir del modo de análisis de frecuencia antes de utilizando su radio, y sintoniza su radio a 9,999 MHz antes de continuar recolectando más datos y deje una nota cuando lo sube.
P: ¿Vas a aceptar datos de I/Q?
R: Sí.
P: Puedo establecer un estación para recoger datos a largo plazo. ¿Estaría interesado en eso?
R: ¡Por supuesto, Sí! Envíenos un correo electrónico a [email protected] para discutir con más detalle.
P: ¿Voy a recibir una tarjeta QSL?
R: ¡Por Supuesto! El festival del Eclipse va a mandar tarjetas a todas las personas que participan cuando el experimento termina.
HamSCI is seeking volunteers, especially in the Eastern Hemisphere, to help us collect data during the annular solar eclipse on June 21. There will be two data collection periods: A practice/control period on June 14 for participants to get their stations in order, and the main data collection period from June 20-22 UTC.
Details of the experiment are found here: https://hamsci.org/june-2020-eclipse-festival-frequency-measurement
If you're interested in participating, please sign up at this link or contact Kristina Collins at [email protected].
The method for this experiment will be similar to the one used for the original Festival of Frequency Measurement, held last year in celebration of the WWV Centennial.
[email protected], 凯斯西储大学业余无线电社团W8EDU
(注:如果中文提问的话也可以发送到这个邮件我们会有专人回复)
注:数据收集时间可以有所变化,但我们需要能够覆盖日食开始到结束的数据集

这次数据采集我们将采用中科院的短波时间电台BPM。BPM电台在上面的地图用蓝点标出。BPM将会在2.5, 5,10兆赫兹上广播。我们此次试验仅采用10兆赫兹数据。如果您想参与,但无法记录10兆赫的信号,请使用任何您可以使用的频率,在提交数据集的时候请注明你所采用的频率。这组数据预计将能够明显的显示观测站当地的日出时电离层的D层的形成,其他日常电离层变化,以及日食对于电离层的影响。太空气象变化多端,有些特征可能很突出。我们希望与您一起通过测量能发现未知的奥秘!
如您有兴趣报名请发送邮件至 [email protected] 并在邮件标题注明“<台号+省份城市>+APAC June 2020 Eclipse Data Station Registration”。如果您愿意,你可以在邮件中用中文/英文介绍一下您的电台,我们很乐意看到不同的无线电电台配置!
使用您最稳定的电台,并使用一个好的声卡(如果您的电台里有声卡,那您不需要外置的声卡)。我们希望您使用开源软件fldigi-4.1.13。它的“frequency analysis”模式生成频率偏差文件,并会为您自动命名为“analysis_<测量日期>.csv”。它将位于目录/fldigi/temp/ (linux系统)或.fldigi/temp/或其他类似目录中。您需要使用此版本的fldigi,否则您的数据会被第二天的数据所覆盖掉,造成数据丢失。
Q:这些数据采集了会被用来做什么?
A:这些数据采集后将由HamSCI组织成员进行分析。所有采集的数据和我们科研的结果都将会被开源共享给所有人。例如上次在WWV百年纪念时的数据采集可以在这里被查看:https://hamsci.org/node/347
Q:我不在日食的路线之中,我能够参加吗?
A:可以,但是如果你距离日食所涉及路径很远,我们不能保证所采集的数据会展示出日食对于电离层所产生的影响,但是有数据总比没有数据好!
Q:我错过了/不能参加6月14日的基准线数据采集,我还能参加吗?
A:当然可以。如果有疑问请联系W8EDU电台
Q:我在使用FLdigi上遇到了困难,请问能否协助我?
A:当然可以,请邮件联系 [email protected] 并在标题注明fldigi help needed CN
Q:我能用FLdigi之外的程序来采集数据吗?
A:当然可以,但是我们将无法帮助你解决程序上的问题。请确保你的数据和fldigi的数据制式相同
Q:我能够采集其他短波调时电台吗?
A:可以,但我们不能确定这个数据可以帮助我们研究。
Q:我们想和你们长期合作,你们有兴趣吗?
A:当然啦,请将您的电台信息发送给 [email protected] .
W8EDU凯斯西储大学无线电社团
Last edit: 30 May 2020
Thanks to all who collected data for the June Eclipse Festival! We hope you'll join us for our next event, the December 2020 Eclipse Festival of Frequency Measurement.
You can view more information about the results here.
Alternate language options:
Chinese: 简体中文介绍
Spanish: Espanol
Dutch: Nederlands taal
Kristina Collins: [email protected]
The beacon station will be BPM, the time service station of the Chinese Academy of Sciences, marked by the blue dot in the map above. BPM broadcasts on 2.5, 5, 10, and 15 MHz. This experiment will use only the 10 MHz transmissions. If you want to participate and cannot record the 10 MHz signal, use whichever frequency you can and make sure the file is labeled appropriately. The recordings in this experiment are expected to show formations of the D-layer at stations' local sunrise and other daily events of the ionosphere, and the effects of the eclipse. Space weather varies day to day and some features may be prominent. We'll see what we get!
Fill out the survey here to sign up.
Frequently Asked Questions
Page Contributors: KD8OXT, AD8Y, KB3UMD, N8OBJ
Last edit: 2 June 2020
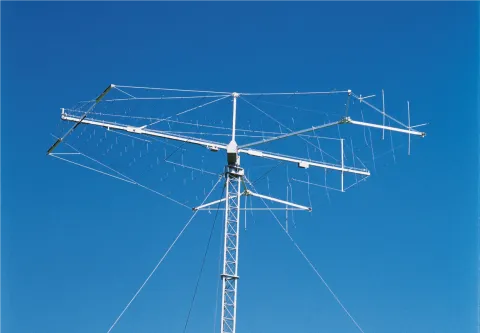
Much of HamSCI research looks at communications in the High Frequency (HF, 3-30 MHz) radio bands. The HF bands allow for both global communications and techniques for remote sensing the ionosphere and space. The HF bands have seen a resurgence in recent years, as new modulation techniques are developed and people realize the importance of diversifying their communications infrastructure. Paul Denisowski, KO4LZ, engineer for Rohde & Schwarz North America recently wrote a white paper entitled, "The Rebirth of HF".
From the paper:
"HF stands for ‘high frequency’ and is usually used to refer to signals with frequencies in the range of 3 MHz to 30 MHz, although in many cases the practical definition of HF has be extended down to frequencies as low as 1.5 MHz. HF is also sometimes referred to, somewhat loosely, as ‘shortwave,’ especially in the context of broadcasting. These HF frequencies correspond to wavelengths in the range of approximately 10 to 100 meters. Given that modern homes contain Wi-Fi access points operating in the gigahertz range and that some 5G deployments are taking place in so-called millimeter-wave bands, the names “high” frequency and "shortwave" may seem a bit misplaced, but it is worth nothing that the first experiments in long-distance radio communication by Marconi around the year 1900 used even lower frequency signals.
One of the best-known applications of HF is worldwide or global communications. Both government and commercial broadcasters can reach listeners worldwide using HF frequencies. This global reach is also extremely useful in many government and military applications, and HF is used extensively by amateur radio operators around the world. This paper will begin with an exploration of the unique properties of HF that enable global communications."
This paper does a good job of outlining many of the fundamentals concerning HF radio and the ionosphere and serves as a good tutorial for introducing some the things that HamSCI studies. This paper is made available here with permission from Dr. Ulrich Rohde, N1UL.
Also available is a presentation by Dr. Rohde on Emerging Trend in 5G, IoT and SDR.
[icon:fontawesome:birthday-cake]
In ut quam vitae odio lacinia tincidunt. Phasellus leo dolor, tempus non, auctor et, hendrerit quis, nisi. Suspendisse nisl elit, rhoncus eget, elementum ac, condimentum eget, diam. Pellentesque ut neque. Praesent ac massa at ligula laoreet iaculis.
Aliquam eu nunc. Curabitur suscipit suscipit tellus. Phasellus magna. Praesent adipiscing. Phasellus ullamcorper ipsum rutrum nunc.
Donec vitae orci sed dolor rutrum auctor. Donec interdum, metus et hendrerit aliquet, dolor diam sagittis ligula, eget egestas libero turpis vel mi. Etiam sollicitudin, ipsum eu pulvinar rutrum, tellus ipsum laoreet sapien, quis venenatis ante odio sit amet eros. Fusce vel dui. Aenean posuere, tortor sed cursus feugiat, nunc augue blandit nunc, eu sollicitudin urna dolor sagittis lacus.
Vestibulum ullamcorper mauris at ligula. Fusce pharetra convallis urna. Duis vel nibh at velit scelerisque suscipit. Sed augue ipsum, egestas nec, vestibulum et, malesuada adipiscing, dui. Vestibulum purus quam, scelerisque ut, mollis sed, nonummy id, metus.
Phasellus tempus. Suspendisse nisl elit, rhoncus eget, elementum ac, condimentum eget, diam. In enim justo, rhoncus ut, imperdiet a, venenatis vitae, justo. Sed consequat, leo eget bibendum sodales, augue velit cursus nunc, quis gravida magna mi a libero. Maecenas ullamcorper, dui et placerat feugiat, eros pede varius nisi, condimentum viverra felis nunc et lorem.
The 2020 HamSCI Workhop will go on! We are moving to an all-digital workshop using Zoom Webinar Services. Registration and participation is free and open to all. Exact details on how to register and participate will be posted to hamsci.org/hamsci2020 no later than Wednesday, March 18th. To prepare and make sure you are ready to participate in the 2020 HamSCI Workshop, please visit the Zoom Website and create free account. You can then download the client software and test it by creating your own free test meeting. The Zoom client will work on Windows, Apple OS X, Linux, Android, iPad, and iPhone.
WWV Festival of Frequency Measurement
Thank you for submitting a poster or demonstration to HamSci 2020! Due to the COVID-19 coronavirus, the conference will be presenting posters and demonstrations digitally over Zoom on Saturday, March 21, 12:30-6:30 pm ET (16:30-22:30 UTC). The session will be moderated, and each presentation will consist of a 5-minute video and 10 minutes for live Q&A. We appreciate your flexibility during this time and look forward to showcasing your work.
In order to show every poster most effectively, we ask that you help us with the following. Please submit all materials to [email protected] by noon on Wednesday, March 18. Please note that these files are frequently too large to be emailed, so you may need to use a sharing service like DropBox or Google Drive. Please let us know if you have questions or need assistance sharing your files. Please note that all videos will be posted to YouTube, and by the nature of Zoom any participant will be able to record your presentation. All content should be approved for public distribution. Please contact us if you have any questions.
Please submit a pdf copy of your poster. Attendees will be downloading a digital copy of your poster, so you are welcome to include links in the file. If possible, please number or otherwise mark your figures and charts for ease of use.
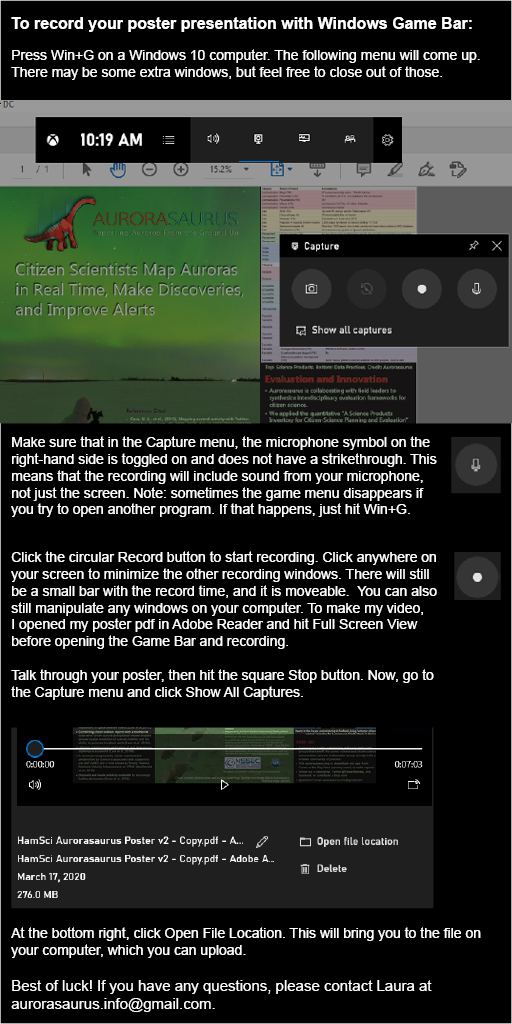
Please create a short video (5 minutes or less) of yourself summarizing your work (example*.) This can be created with a smartphone or laptop camera. Your work will be introduced by a moderator during the session, so you do not need to include title cards in the video. If you have a printed version of your poster you are welcome to use it as a visual, but you can also just film yourself as if you are in a webmeeting, or use a tool like the Windows Game Bar to film your poster.
Please note that due to screen resolution, your viewers will be relying on their pdf of your poster for specifics. When you reference your poster, whether visually or verbally, please use extra-specific cues. For example:
“The radio I constructed uses a new design. Please look at the top left corner of my poster, at the blue box marked Figure 1."
“You can find my reference list at the bottom of the center section of my poster, labeled ‘References’ and overlaying a photo of the sky.”
“On the right-hand side of the poster, toward the middle, there are three graphs. Take a look at Graph 3 on the right, the one with the strong peak in the center.”
Please speak clearly and at a relaxed pace so that viewers can understand you if their audio quality or internet connection are not as strong.
Please note that the video will be posted to YouTube during and after the conference
Thank you again for your flexibility. We look forward to a safe and exciting HamSci Workshop! If you have any questions, please do not hesitate to contact us at [email protected].
* Laura used Windows Game Bar to record her presentation. Instructions:
As of March 11, 2020, we have continued to monitor the coronavirus situation and find that it is no longer feasible to hold an in-person HamSCI workshop this year. This has been a very difficult decision to make, as a tremendous amount of planning and effort by many people have gone into preparing for the workshop. We will refund all registrations for this event. Please take this time to cancel any travel arrangements you may have made to attend the workshop. If the University of Scranton has made arrangements for you, we will cancel them for you and be in touch with you regarding the situation. Questions regarding the current status may directed to [email protected].
The Science/Program Committee is discussing over the next few days the best alternative plans for the HamSCI workshop. This may mean a form all-electronic meeting using teleconference/webinar services. Please check back on this page for more information.
By Stan Zygmunt, University of Scranton
Registration is now open for the third annual HamSCI Workshop. The 2020 HamSCI Workshop for amateur radio operators and professional scientists will be held Friday and Saturday, March 20-21, at The University of Scranton. The theme of the workshop is “The Auroral Connection,” and will include addresses by guest speakers, poster presentations and demonstrations of relevant instrumentation and software. All ham radio operators, scientists, and people interested in ionospheric and space physics are welcome to attend.
The workshop will serve as a team meeting for the HamSCI Personal Space Weather Station project, which is a National Science Foundation (NSF) funded project awarded to University of Scranton physics and electrical engineering professor Nathaniel Frissell, Ph.D. The project seeks to harness the power of a network of licensed amateur radio operators to better understand and measure the effects of weather in the upper levels of Earth’s atmosphere. Through the grant, Dr. Frissell, a space physicist, will lead a collaborative team that will develop modular, multi-instrument, ground-based space science observation equipment and data collection and analysis software. He will also recruit multiple universities and ham radio users to operate the network of “Personal Space Weather Stations” developed. In addition to Scranton, the Personal Space Weather Station project includes participation from TAPR (Tucson Amateur Packet Radio) amateur radio engineering organization, Case Western Reserve University amateur radio club W8EDU, the University of Alabama, the New Jersey Institute of Technology Center for Solar-Terrestrial Research, MIT Haystack Observatory, Dartmouth College and the ham radio community at large.
The keynote address for the HamSCI Workshop 2020 will be given by Tim Duffy, K3LR, chief operating officer and general manager at DX Engineering, an active amateur radio operator and well-known contester. He serves as chairman of Contest University, the Dayton Contest Dinner and the Top Band Dinner, as well as coordinator of the Contest Super Suite. He is the founder and moderator of the popular RFI Reflector. Duffy serves on the board of directors of the World Wide Radio Operators Foundation and as chairman and president emeritus of the Radio Club of America. He was elected to the CQ Contest Hall of Fame in 2006 and was honored with the prestigious Barry Goldwater Amateur Radio service award by the Radio Club of America in 2010.
Speakers at the workshop include Elizabeth MacDonald, Ph.D., the NASA researcher that founded and leads the Aurorasaurus project. Dr. MacDonald will discuss fundamentals of auroral physics, its optical signatures, and the Aurorasaurus citizen science project. James LaBelle, Ph.D., professor of physics and astronomy at Dartmouth University and auroral radio physicist, will discuss radio signatures of the aurora, remote sensing using active and passive techniques, and ways the amateur radio/HamSCI community could contribute. Also, David Hallidy, amateur radio call sign K2DH, a retired microwave engineer who is also a well-known amateur radio operator for his work in auroral mode propagation, will discuss his practical experiences of using the aurora for radio communication purposes.
Additional information, attendance fees and registration can be found on the HamSCI Workshop 2020 website.
The TangerineSDR is the TAPR-HamSCI joint project to create a software defined radio that meets the joint needs of the amateur and scientific communities. The TangerineSDR is slated to be at the heart of the high-performance version of the HamSCI Personal Space Weather Station. In his January/February 2020 QEX article, TangerineSDR Chief Architect Scotty Cowling WA2DFI explains the requirements and use cases of the TangerineSDR. Full text of the article is availble here. Reprinted with permission; copyright ARRL.
Main workshop page: http://hamsci.org/hamsci2020
Google Doc With for Questions
HamSCI Glossary
| Eastern Daylight Time | UTC | Title | Presenter | Organization |
|---|---|---|---|---|
| Opening Remarks & Oral Session I Personal Space Weather Station Engineering & Science Chair: Dr. Nathaniel Frissell W2NAF; Zoom Moderators: Bill Liles NQ6Z & Diego Sanchez KD2RLM |
||||
| 9:30 AM | 1330z | Opening Remarks / Webinar Opens | ||
| 9:45 AM | 1345z | Overview of the Personal Space Weather Station and Project Update | Nathaniel Frissell W2NAF | The University of Scranton |
| 10:00 AM | 1400z | TangerineSDR Data Engine and Overall Architecture | Scotty Cowling WA2DFI | TAPR |
| 10:20 AM | 1420z | TangerineSDR Dual‐Receiver RF Module Design | Tom McDermott N5EG | TAPR |
| 10:40 AM | 1440z | TangerineSDR Clock Module Design | John Ackermann N8UR | TAPR |
| 11:00 AM | 1500z | TangerineSDR Database and Control System Architecture | William D. Engelke AB4EJ | University of Alabama |
| 11:20 AM | 1520z | Magnetometer Support for the Personal Space Weather Station and Related Projects | David M. Witten, III KD0EAG, Frances Bonte KE8HPA, & Hyomin Kim KD2MCR | TAPR; DeSales High School, Columbus, OH; New Jersey Institute of Technology |
| 11:40 AM | 1540z | Break | ||
| Oral Session II Personal Space Weather Station Engineering & Science Chair: Dr. Nathaniel Frissell W2NAF; Zoom Moderators: Dr. Gareth Perry KD2SAK & Dr. David Larsen KV0S |
||||
| 12:00 PM | 1600z | Update on the Low‐Cost Personal Space Weather Station | Kristina Collins KD8OXT & David Kazdan AD8Y | Case Western Reserve University |
| 12:20 PM | 1620z | Synchronized Multiple Radio Telescope Microwave SETI | Skip Crilly K7ETI | Green Bank Observatory |
| 12:40 PM | 1640z | WWV Time Tick Arrival Time Study to Investigate Multiple Modes During Daily Dawn and Dusk Transitions | Steve Cerwin WA5FRF | HamSCI Community |
| 1:00 PM | 1700z | David McGaw N1HAC | Dartmouth College | |
| 1:20 PM | 1720z | Amateur digital mode based remote sensing: FT8 use as a radar signal of opportunity for ionospheric characterization | Phil Erickson W1PJE | MIT Haystack Observatory |
| 1:40 PM | 1740z |
Lunch Discussion (Open Webinar) |
||
| Oral Session III Eclipses and Citizen Science Chair: Dr. Nathaniel Frissell W2NAF; Zoom Moderators: Dr. Laura Lukes KK4FYT & Dr. MD Maktoomi |
||||
| 2:50 PM | 1850z | Update on the Golden Ears Project | Gareth Perry KD2SAK | New Jersey Institute of Technology |
| 3:10 PM | 1910z | Observations and Modeling Studies of the Effects of the 2017 Solar Eclipse on SuperDARN HF Propagation | Magdalina Moses KM4EGE | Dartmouth College |
| 3:30 PM | 1930z | EclipseMob: Initial Planning for 2024 | William Liles NQ6Z | HamSCI Community |
| 3:50 PM | 1950z | A new CHAIN site in New Brunswick: low‐cost HF and GNSS instruments for Solar Eclipse 2024 | Aaron Farnham VE9CG, Anton Kashcheyev | University of New Brunswick |
| 4:10 PM | 2010z | Propagation Teepee: A High Frequency (HF) Radio Spectral Feature Identified by Citizen Scientists | Shing F. Fung | NASA Goddard Space Flight Center |
| 4:30 PM | 2030z | Break | ||
| Oral Session IV Citizen and Professional Space Science Results Chair: Dr. Nathaniel Frissell W2NAF; Zoom Moderators: Kristina Collins KD8OXT & Dr. Phil Erickson W1PJE |
||||
| 4:50 PM | 2050z | Using amateur radio to validate model‐based properties of earth's protective shield | David A. Smith W6EY | Utah State University |
| 5:10 PM | 2110z | Statistical Study of Open Closed Boundaries (OCB) using ULF Wave Observations from Antarctic AGOs, McMurdo Station, and South Pole Station | Rachel Frissell W2RUF | New Jersey Institute of Technology |
| 5:30 PM | 2130z | Temporal and Spatial Development of TEC Enhancements during Substorms | James Weygand | UCLA |
| 5:50 PM | 2150z | Large Scale Traveling Ionospheric Disturbances Observed using HamSCI Amateur Radio, SuperDARN, and GNSS TEC | Diego Sanchez KD2RLM | Essex County College |
| 6:10 PM | 2210z | Let’s Push the Exploration of the Ionosphere to The Next Level (Invited) | Tim Duffy, K3LR | Team K3LR, World Wide Radio Operators Foundation (WWROF), and DX Engineering |
| 6:30 PM | 2230z | Closing Discussion and Remarks | ||
| Eastern Daylight Time | UTC | Title | Presenter | Organization |
|---|---|---|---|---|
| Invited Tutorials I Auroral Connection: Optical and Radio Auroral Physics Chair: Dr. Nathaniel Frissell W2NAF; Zoom Moderators: Laura Brandt & Dr. Phil Erickson W1PJE |
||||
| 9:30 AM | 1330z | Opening Remarks / Webinar Opens | ||
| 10:00 AM | 1400z | Aurorasaurus: Citizen Science Observations of the Aurora (Invited Tutorial) | Elizabeth MacDonald | NASA Goddard Space Flight Center, New Mexico Consortium |
| 10:45 AM | 1445z | Observing Radio Signals of Auroral Origin (Invited Tutorial) | James LaBelle | Dartmouth College |
| 11:30 AM | 1530z |
Break |
||
| Invited Tutorials II Auroral Connection: Auroral Model Ham Radio and Ham Radio History Chair: Dr. Nathaniel Frissell W2NAF; Zoom Moderators: Dr. Liz MacDonald & Carl Luetzelschwab K9LA |
||||
| 11:45 AM | 1545z | Operating Auroral Mode Ham Radio (Invited Tutorial) | David Hallidy K2DH | HamSCI Community |
| 12:30 PM | 1630z | Nikola Tesla – The Pioneer who Paved the Road to the World and Ham Radio as We Know It (Invited Tutorial) | Jim Breakall WA3FET | Penn State University |
| 1:00 PM | 1700z |
Lunch Discussion (Open Webinar) |
||
|
ePoster/eDemo Session I |
||||
| 2:00 PM | 1800z |
Into the Ionosphere: Real-Time Aurora Mapping Through Citizen Science |
Laura Brandt | New Mexico Consortium, NASA |
| 2:15 PM | 1815z | An Aurorasaurus Citizen Science Database of Strong Thermal Emission Velocity Enhancement (STEVE) Observations |
Michael Hunnekuhl, presented by Elizabeth MacDonald |
Aurorasaurus Community |
| 2:30 PM | 1830z | Live Aurora Network | Michael McCormack NQ1O | Live Aurora Network |
| 2:45 PM | 1845z | Construction of an Aurora Camera in North Dakota to Aid in Citizen Science and Space Weather Applications | Vincent Ledvina | University of North Dakota |
| 3:00 PM | 1900z | Novel methods for characterizing ionospheric irregularities in the high-latitude ionosphere | Lindsay V. Goodwin | New Jersey Institute of Technology |
| 3:15 PM | 1915z | Break | ||
| ePoster/eDemo Session II HamSCI Posters/Demos Chair: Laura Brandt; Zoom Moderators: Carl Luetzelschwab K9LA & Dr. Gareth Perry KD2SAK |
||||
| 3:30 PM | 1930z | Patterns in Received Noise: Methods, Observations and Questions | Gwyn Griffiths G3ZIL | HamSCI Community |
| 3:45 PM | 1945z | Neutral Winds in the Equatorial Thermosphere as Measured With the SOFDI Instrument | Sovit Khadka | New Jersey Institute of Technology |
| 4:00 PM | 2000z | Using a PVC Pipe antenna and a Raspberry Pi to Detect VLF Natural Radio | Jonathan Rizzo KC3EEY | The University of Scranton |
| 4:15 PM | 2015z | Electromechanical ELF Transmitters for Wireless Communications in Conductive Environments | Jarred Glickstein & Soumyajit Mandal | University of Florida |
| 4:30 PM | 2030z | Visualizing the Electromagnetic Spectrum in the Time Domain | Stephen Hamilton KJ5HY & Charles Suslowicz KD2RQS | West Point |
| 4:45 PM | 2045z | Break | ||
| ePoster/eDemo Session III HamSCI Posters/Demos Chair: Laura Brandt; Zoom Moderators: Kristina Collins KD8OXT & Dr. David Kazdan AD8Y |
||||
| 5:00 PM | 2100z | Nolan Pearce KE8JCT | West Point | |
| 5:15 PM | 2115z |
Jonathan M. Smith
|
NASA Goddard Space Flight Center
|
|
| 5:30 PM | 2130z | Visualizations of HF Doppler Observations | Aidan Montare KB3UMD |
Case Western Reserve University
|
| 5:45 PM | 2145z | The Language of Amateur Radio | David Vine WA1EAW |
:Amateur Radio Club of Augusta
|
| 6:00 PM | 2200z | Closing Discussion and Remarks | Nathaniel Frissell W2NAF | The University of Scranton |

This week, many HamSCI members are presenting their research at the American Geophysical Union (AGU) Fall Meeting in San Francisco. The AGU Fall meeting is one of the largest geoscience meetings in the world, and consists of about 24,000 attendees. The scientific program includes sessions pertaining to all areas of geophysics, including space weather, the solar wind, auroral activity, the ionosphere, and the neutral atmosphere. Below is a list of selected presentations and sessions being given by HamSCI members, or of general interest to ham radio operators. The complete scientific program is available here.
Traveling ionospheric disturbances are space weather in nature and cause fluctuations in electron density that can have impacts on HF propagation. Two techniques, GNSS based total electron content (integrated density through the ionosphere and plasmasphere), and incoherent scatter radar (direct altitude profiles of temperature, density, velocity), can provide spatial structure information on these disturbances.
Solar flares cause D region based HF blackouts, but have effects through the ionosphere and neutral atmosphere. September 2017 was characterized by multiple solar flares as well as large geomagnetic storm perturbations. Studying these helps understand the system's response to forcing.
At mid-latitudes over North America, we have known for more than a decade that HF radars (SuperDARN) see almost constant backscatter from small-scale irregularities moving at slow ionospheric speeds. The causes of these irregularities are still under investigation, but they are very useful as a remote diagnostic. This will give updates on progress toward understanding the irregularity origins. Their presence may cause short time period HF propagation path changes.

HamSCI has an opening for a Post-Doctoral Research Associate! Please see the advertisement below.
The University of Scranton Department of Physics and Engineering seeks a post-doctoral research associate starting in Spring/Summer 2020 in support of a recently awarded NSF-supported Distributed Array of Small Instruments (DASI) grant to develop a prototype Personal Space Weather Station. The successful post-doctoral researcher will conduct software development, and subsequent scientific studies, for a multi-site geographically distributed high frequency (HF; 3 – 30 MHz) software defined radio (SDR) network using signals of opportunity. Primary responsibilities will involve the development and implementation of an ionospheric sounding algorithm using the HF observation network for the purpose of studying geospace phenomena: traveling ionospheric disturbances, ionospheric responses to solar flares, geomagnetic storms and substorms, and other space weather effects. The ideal candidate will have expertise in ionospheric remote sensing, geospace physics including the ionosphere and thermosphere, and digital signal processing algorithm development and implementation.
The post-doctoral research associate will also author scientific and/or technical journal publications on research results, and will assist in advising and leading a team of University of Scranton undergraduate students working on this project. This is a highly collaborative project that offers regular travel to professional meetings and numerous opportunities for professional networking and growth. Collaborators include researchers at Case Western Reserve University, New Jersey Institute of Technology, University of Alabama, MIT Haystack Observatory, and the amateur radio community through the Ham Radio Science Citizen Investigation/HamSCI initiative.
Interested applicants should apply a https://universityofscrantonjobs.com/postings/4550, and will be asked to submit a cover letter describing research interests and experience, a CV, and the contact information for two references. For additional information, please contact Nathaniel Frissell ([email protected]). Application review begins February 1, 2020 and will continue until the position is filled.