Publications

SEQP and JT-Modes; Rules Update

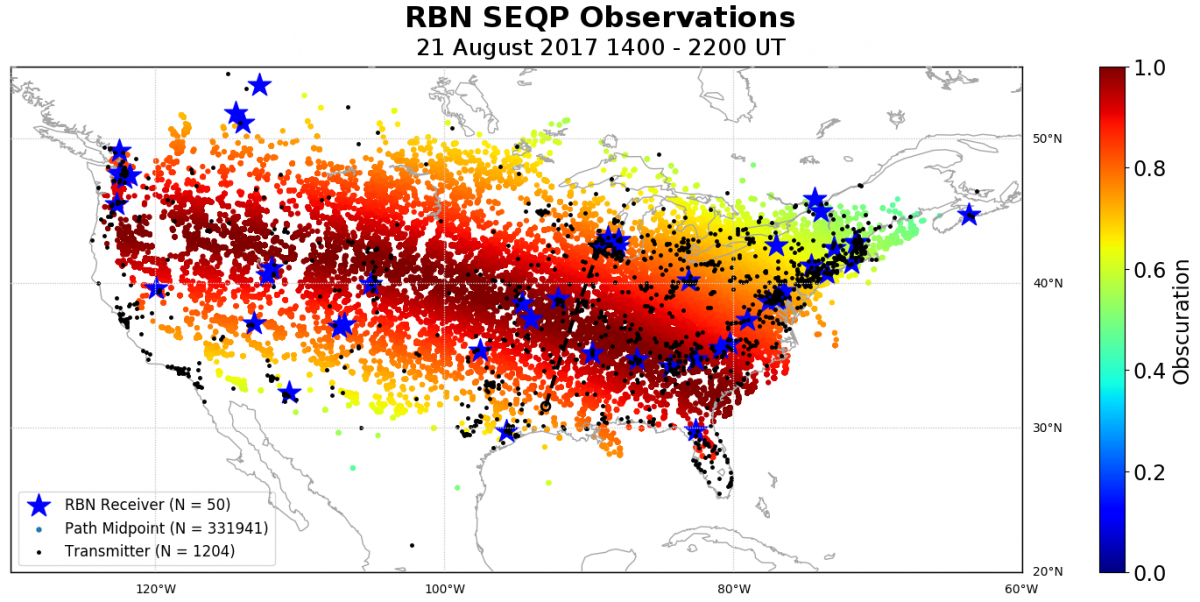
I’ve received community feedback that people want more guidance on running JT-modes during the SEQP. As a result, we have revised rules. There are some also changes to provide guidance in other areas as well, including using SNRs or RSQs for digital mode signal reports. None of these changes affect the scoring procedure, but hopefully they will make the operating procedures more clear. Also, I’ve been made aware that there is currently a bug in N1MM+ that prevents SEQP signal reports from being saved to ECLIPSE Cabrillo files. The N1MM+ developers tell me this bug will be fixed in the next public release. Please let us know if you have any comments by sending an e-mail to [email protected]. Thanks!
 
73,
Nathaniel W2NAF
--------------------------------------------------
Nathaniel A. Frissell, Ph.D.
Assistant Research Professor
Center for Solar-Terrestrial Research
New Jersey Institute of Technology
Tiernan Hall, Room 101
161 Warren Street, Newark, NJ. 07102
(973) 787-4506
--------------------------------------------------

N6TV - Red Pitaya Combine CW & RTTY Skimmer & HDSDR

(These posts originally appeared in the SkimmerTalk reflector, but have been edited and updated with current information and links.  Last updated by N6TV 2017-07-31 23:26 UTC).


From: Bob Wilson, N6TV <[email protected]>
Date: Sun, Jul 23, 2017 at 11:48 PM
Subject: New info. about running Skimmer using the latest 0.97 Red Pitaya OS
To: SkimmerTalk Reflector <[email protected]>

Summary:
  • Ignore my previous warnings.  All Red Pitaya's shipping with OS v0.97 actually do install and run Pavel Demin's SDR Receiver compatible with HPSDR (0.94) just fine using the built-in web installer.  But you must modify /etc/rc.local to get it to start automatically at boot time.
     
  • For RTTY Skimming on Windows 7 or later, ignore "C:\Program Files (x86)\Afreet\RttySkimServ\RttySkimServ.ini" (if any).  Instead, edit "%appdata%\Afreet\Products\RttySkimServ\RttySkimServ.ini" to match center frequencies, segments, and FreqCalibration used by CW Skimmer Server.
     
  • To run HDSDR while skimming, you have to install IPP51 and vcredist_86.exe in addition to CWSL_Tee
     
  • Use a 5V fan to keep it cool
Details:
 
Thanks to direct email help from SDR developer Pavel Demin, I've learned a lot about the Red Pitaya operating systems in the last few days, and I need to update some of the incorrect statements I originally posted about installing the SDR software required to start skimming (see my note of June 30th, 2017, below).  The previously-documented method using Pavel's pre-built "0.95 ecosystem" SD card image works fine, but you will be installing an out-of date and quite limited "BusyBox" Linux operating system that has several limitations, including:
  1. The root password is not retained between power cycles
  2. The clock is not set automatically at power-up
  3. A RAM disk used, so any changes or logs written to the local file system disappear between power cycles
  4. There is no easy way to install useful software tools using the handy "apt-get" command (e.g. apt-get install dos2unix)
  5. The command prompt doesn't display the standard hostname (rp-XXYYZZ) or the current working directory name
In contrast, the current OS shipped with new Red Pitayas (v0.97) is a full-function Ubuntu version 16 operating system, and it does not have any of the limitations listed above.  It automatically sets the clock to UTC, provides a useful command prompt string, and any changes to the root password or file system are always retained across power cycles.
 
Ubuntu seems to be the strategic direction for future Red Pitaya software releases, and some of their apps will require it.  FYI, version "0.96" was yet another Red Pitaya Linux variant OS called "Debian."  It's also full-function, but it seems the Red Pitaya developers have decided to go with Ubuntu instead.
 
The good news is that it is much easier to install the required SDR receiver software now.  Contrary to what I posted at first, Pavel Demin's SDR Receiver compatible with HPSDR (0.94) works quite well with Skimmer on the version 0.97 operating system, and you can easily install and run it using the web page that runs on the box.  What I failed to understand when I first tried that, is that you have to keep your Windows web browser open after you click "Install" and "Run," otherwise the receiver stops running as soon as you close the web page, and Skimmer won't work.
 
Fortunately, there's an easy way to install the right SDR Receiver and have it start automatically at boot time under 0.97, with no need to open a web browser to manually start it, and no need to build a new microSD card.  So here are the steps:
  1. Power up the Red Pitaya using the microSD card image shipped with new units.  If you already wiped it out, you can recreate it by following all the steps here.  I've tried both "Stable" and "Beta" 0.97 operating systems, and they both work.
  2. Determine the IP address assigned to the Red Pitaya.  From Windows, the command ping rp-XXYYZZ may reveal it, where XXYYZZ represents the last six digits of the MAC address printed on the Red Pitaya's Ethernet connector.  Your router will also display the assigned IP address, or the Windows command arp -a may as well.
  3. Open a web browser and go to http://192.168.1.xx (use whatever IP address was assigned to your Red Pitaya by your Router)
  4. Click on the green Application marketplace icon
  5. Scroll down to the SDR Receiver compatible with HPSDR (not the other receiver), and click Install
  6. It should finish installing in less than 30 seconds, then click Run
  7. At this point as long as you don't close the web page that opens after you click Run, you can start your Skimmer Server software and it should find the Red Pitaya (use the 17.7.6 HermesIntf.dll as described in my original post below)
  8. Exit Skimmer Server and close your web browser (in that order).  This will terminate the receiver.
Once installed and tested, to make the SDR Receiver run automatically whenever the Red Pitaya is rebooted, just edit or replace the file named /etc/rc.local on the machine (once).  It needs to have two lines added before the exit 0 command, so the end of the file looks like this
 
# Start the SDR Receiver compatible with HPSDR at boot time
cat /opt/redpitaya/www/apps/sdr_receiver_hpsdr/sdr_receiver_hpsdr.bit >/dev/xdevcfg
. /opt/redpitaya/www/apps/sdr_receiver_hpsdr/start.sh
 
exit 0
 
The dot ( . ) on the 3rd line above is required.
 
Rather than trying to cut and paste this, I've placed a copy of this edited file at http://www.kkn.net/~n6tv/rc.local .  Here's the easiest way to copy it to the Red Pitaya:
  1. Install Putty for Windows and open an SSH connection (like a TELNET connection) to the Red Pitaya's IP address.

    Userid: root
    Password: root
     
  2. You should see a login message at the very top that says:

    Welcome to Ubuntu 16.04.2 LTS (GNU/Linux 4.4.0-xilinx armv7l)

    or similar
     
  3. If you haven't done so already, change the root password using the command:

    passwd
     
  4. Enter the following five Unix commands in sequence (updated 2017-07-31):

    cd /etc
    mv rc.local rc.local.old
    wget http://www.kkn.net/~n6tv/rc.local

    chmod +x rc.local
    nano rc.local
         (Verify the file's contents match what I've documented above.  Press Ctrl-X to exit the nano editor.)
    reboot
At this point, the SSH session will terminate, but when the machine reboots, and the "heartbeat" LED is blinking, the SDR receiver will be running, and you'll be able to start skimming using the latest Red Pitaya OS.
 
Warning:  do not open the Application marketplace from the web browser while the SDR receiver is running, otherwise the SDR receiver may halt. From the Ubuntu command prompt you can manually stop the receiver by running:
 
/opt/redpitaya/www/apps/sdr_receiver_hpsdr/stop.sh
 
Finally, I left out one important step when describing how to use HDSDR to listen to the Red Pitaya receiver while it is skimming.  In addition to copying CWSL_Tee.dll to the HDSDR installation directory, and selecting CWSL_Tee on RP-XXYYZZ in Skimmer Server, you must download and install IPP51.
 
The procedure is well documented here:
 
 
The only thing I can't do (yet) on this new OS is monitor the FPGA temperature while the receiver is running.  I found a shell script called xadc.sh that works OK when the receiver is stopped, but it locks up the Red Pitaya immediately if you run it while the SDR Receiver is running, and the only way to recover from that lockup is to power off and on.
 
Update  2017-07-30:  
I've fixed the xadc.sh script so that you can read the CPU temperature without locking up the Red Pitaya.  If running Ubuntu (0.97), you may download and run a copy by signing on to the Red Pitaya and issuing the following commands:
 
chmod +x xadc.sh
./xadc.sh
 
Result:
 
in_temp0 = 64.84 °C
in_voltage0_vccint = 1.00 V
in_voltage1_vccaux = 1.80 V
in_voltage2_vccbram = 1.00 V
in_voltage3_vccpint = 1.00 V
in_voltage4_vccpaux = 1.80 V
in_voltage5_vccoddr = 1.50 V
in_voltage6_vrefp = 0 V
in_voltage7_vrefn = 0 V
 
Previous temperature measurements returned by xadc_get_value_temp when running the 0.95 image on BusyBox image revealed:
 
Red Pitaya with aluminum "heat sink" enclosure, no fan:
 
~78° C. (scary, 85° C. is max rating)
 
Red Pitaya with aluminum "heat sink" enclosure and a small fan bolted to the top center (I had to drill mounting holes and bend the connector pins on the board to fit the connector):
 
~68° C.
FreqCalibration=1.00000355
 
Red Pitaya in plastic enclosure with original heat sink, and a fan mounted on top of the plastic enclosure:
 
~62° C.
 
Red Pitaya in plastic enclosure with fan mounted inside the enclosure, with one corner crew touching the heat sink:
 
~58° C.
FreqCalibration=1
 
The last solution is best, but it is also the noisiest.  I used two small 4-40 Nylon nuts and bolts to mount the 30 mm x 30 mm x 10 mm 5 VDC fan. The positive connector pin is the one closest to the center of the board. 
 
Update 2017-07-30:  If you're still running the 0.95 Linux BusyBox image, and you want to check the FPGA temperature:
  1. Download

    https://sites.google.com/site/hansdorn/pics/xadc.tgz

    using a web browser (the wget commmand doesn't work)
     
  2. Copy xadc.tgz to the Red Pitaya.  On Windows (when Putty installed), use the command:

    pscp -p xadc.tgz [email protected]:/tmp

    (Substitute the IP address of your RP.  Command will prompt for the root password)
     
  3. Open a putty session to the Red Pitaya, then issue the following commands, in order:

    cd /tmp
    gunzip xadc.tgz
    tar xvf xadc.tar
    export PATH="$PATH$:/tmp/xadc"
    xadc_get_value_temp
73,
Bob, N6TV

From: Bob Wilson, N6TV <[email protected]>
Date: Fri, Jun 30, 2017 at 10:40 PM
Subject: CW Skimmer + RTTY Skimmer running simultaneously on Red Pitaya - Success!
To: SkimmerTalk Reflector <[email protected]>

I finally succeeded in getting both CW and RTTY Skimmer to run simultaneously on a single Red Pitaya SDR.  I hope someone else can confirm that the procedure below works for them too.
 
Furthermore, I am able to view a live waterfall display and listen to any band being monitored by the same SDR at the same time, using the HDSDR software.  And finally, I was able to configure the RBNAggregator to launch both skimmers automatically and in the right sequence.
 
N6TV_RedPitaya_CW_and_RTTY_Skimmer_and_HDSDR.png
 
I'm not sure if the procedure for doing this on the Red Pitaya has been well-documented yet, so here's what to do.  It's similar to the process for the QS1R, with some very important differences.
 
Red Pitaya Hardware and SDR Setup:
  1. The only Red Pitaya OS version that worked for me was the Customized SD Card Image linked below (Update 2017-07-30: see new info. above).  Do not waste time trying any other versions, such as the one that comes pre-installed on the Red Pitaya micro SD card, even though it's newer, or version 0.94 on the Red Pitaya web site (Update 2017-07-30:  these are acutally OK)
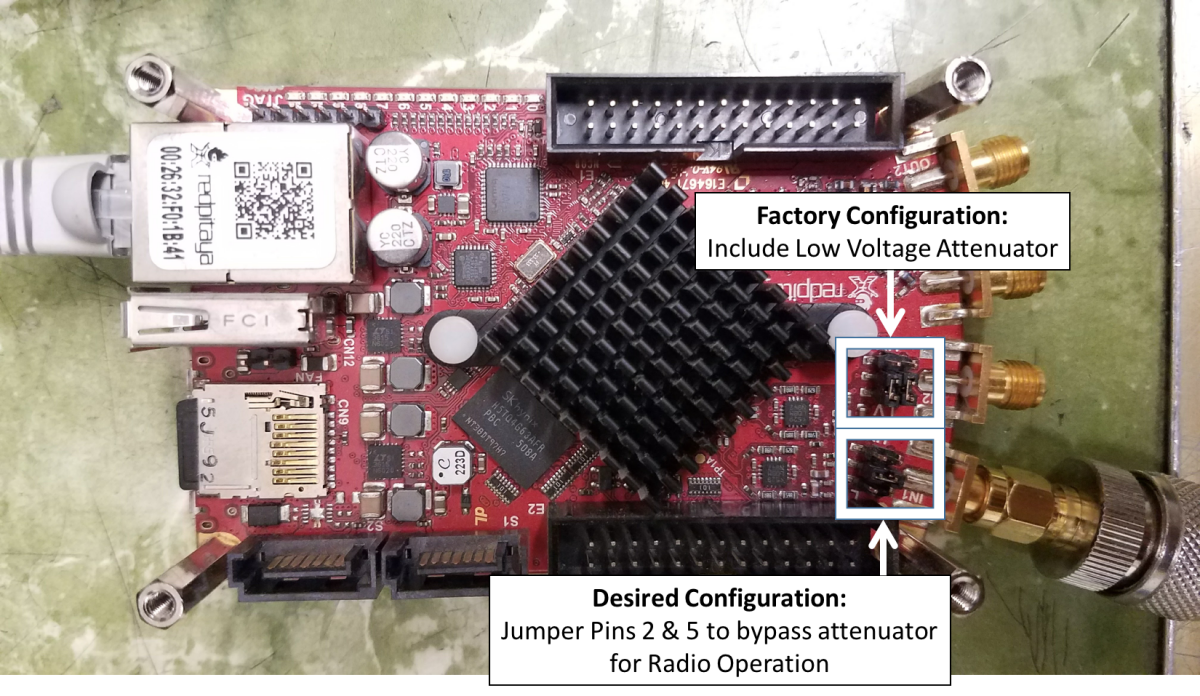
  2. As discovered by K1TTT, use a single jumper to bypass the 1M ohm input impedance circuit.  Connect pins 2 and 5 (the two middle pins) together (pictures in W2NAF's doc linked below)
  3. I'm using a tiny 14:1 transformer supplied by Red Pitaya on the input.  At this time they are not planning to sell it separately; it will only be supplied with their new transceiver kit. It is a MiniCircuits model T14-1+ mounted on a small PC board with male and female SMA connectors.
  4. I found a 10 dB preamp to be helpful on the high bands with my antenna.  Without it, I saw no change in noise floor when I disconnected the antenna on the high bands.  It was very nice to watch the noise floor in HDSDR.
  5. Configuration:  VE3DO Loop Antenna -> DX Engineering Receiver Guard -> 10 dB Pre-Amp -> 14:1 transformer -> Red Pitaya Input 1.
  6. I recommend a short BNC to SMA pigtail, rather than a BNC to SMA adapter, to reduce strain on the SMA connector.  One example is the JetStream JT4130J3 sold by GigaParts.
Quick Summary, for Windows (software links follow):
  1. Copy CWSL_Tee.dll to the SkimSrv installation directory
  2. Copy CWSL_Tee.dll to the RttySkimServ installation directory
  3. Copy HermesIntf.dll to the SkimSrv installation directory
  4. Do NOT (repeat, do NOT) copy HermesIntf.dll to the RttySkimServ directory, otherwise everything stops when you try to start RTTY Skimmer Server after CW Skimmer Server
  5. Create a two-line file named CWSL_Tee.cfg containing only these two lines and nothing more:

    HermesIntf
    64
     
  6. Save CWSL_Tee.cfg in the SkimSrv directory
  7. Copy CWSL_Tee.cfg to the RTTYSkimServ directory
  8. Copy CWSL_Tee.cfg to the RBN Aggregator directory (a very important step)
  9. Copy ExtIO_CWSL.dll to the HDSDR installation directory, nothing more
  10. Just as for the QS1R, configure both SkimSrv/SkimSrv.ini and RttySkimServ/RTTYSkimServ.ini with identical values for the following lines:
    (mostly left blank below, for clarity):
    DeviceName=01 CWSL_Tee on
    FreqCalibration=1
    CenterFreqs48=
    CenterFreqs96=
    CenterFreqs192=
    SegmentSel48=
    SegmentSel96=
    SegmentSel192=
    Rate=1
  11. In SkimSrv.ini use:
    [Telnet]
    Port=7300
    In RTTYSkimServ.ini use:
    [Telnet]
    Port=7301
    (value not critical, but the two skimmers must not be using the same TELNET port)
  12. Manually start CW Skimmer Server first
  13. If necessary, select the SDR named "01 CWSL_Tee on ..." and verify normal operation. If the device name displays strange characters, it means you are using an outdated version of HermesIntf.dll (a fix was made available by K3IT on 2017-07-06)
  14. Manually start RTTY Skimmer Server second
  15. Verify that both skimmers are still running and show no errors or warning messages.
    If you get errors, note them and immediately terminate both skimmer programs.
    Look at the CWSL_Tee and HermesIntf log files written to both directories to help identify the problem
  16. (optional) Start HDSDR and select ExtIO_CWSL.dll when prompted
  17. In HDSDR, use only the small pull-down menu in the ExtIO pop-up dialog to change bands.  You can listen to any band being monitored by the Skimmers.  Do not change the LO frequency, only the TUNE frequency (just click on the spectrum or waterfall)
Once the above is verified as operational, it's time to test the process via the RBN Aggregator.
  1. Terminate HDSDR, RTTY Skimmer Server, and CW Skimmer Server, in that order
  2. Launch the RBN Aggregator and quickly click on the ini Files tab and select Stop Rotation
  3. Check the path and file names make sure you're launching SkimSrv.exe, and the same SkimSrv.ini file edited previously.  View the file with the Edit button to verify.
  4. On the Secondary Skimmers tab, last slot (#8), select IP address 127.0.0.1 port 7301 or whatever you used in RttySkimServ.ini
  5. On the RttySkimServ tab, verify the full path to RttySkimServ.exe and RttySkimServ.ini - do not use any other file name here.
  6. Check the box Force RTTY Skimmer Server to follow CW Skimmer Server
  7. Go back to the ini Files tab and click the NOW button next to the proper SkimSrv.ini to launch both skimmers, in order.
  8. Verify that both Skimmer Servers start up normally with no errors, and show one telnet connection each.
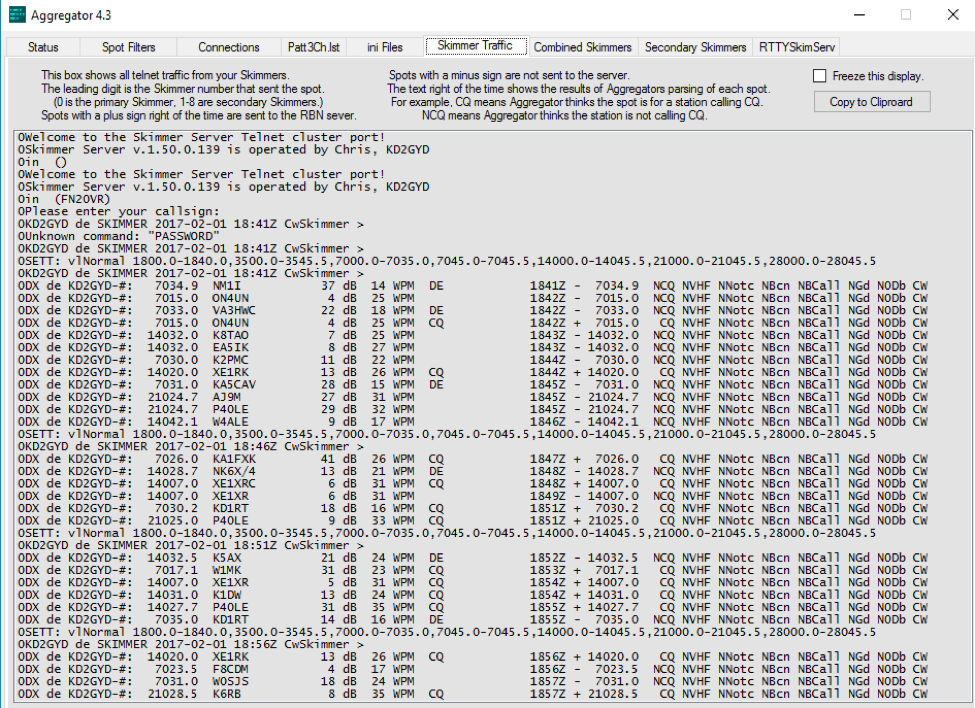
  9. In the Skimmer Traffic tab of the Aggregator, you should see messages indicating telnet connections to both CW Skimmer and RTTY Skimmer
  10. In the Status tab, there should be no errors
  11. If you do have errors, look for HermesIntf and CWSL_Tee log files in the Aggregator directory.  The most common problem is not having the correct CWSL_Tee.cfg file in the Aggregator directory.
Here are useful links to all the required software files and extras, with proper credit to all the developers and enthusiasts who made it possible for simple folks like us to replace our failed QS1Rs with a Red Pitaya or two:
Random notes on the Red Pitaya:
  1. We all owe Pavel Demin a big THANK YOU for his Red Pitaya SDR Receiver.
  2. Follow the steps in W2NAF's excellent Red Pitaya RBN How-To Guide exactly; don't take any shortcuts:
    • The Red Pitaya Starter kit includes a new and improved v0.97 operating system, which boots fine and has handy features, but I have not been able to find a binary version of Pavel Demin's HPSDR code that runs on it (Update: 2017-07-30 - it works fine, see note of July 23rd above).
    • For now, use only the v0.95 ecosystem Zip image linked above (Update 2017-07-30 - the v0.97 Ubuntu image is now preferred).
    • Insert the micro SD card and adapter included with the Red Pitaya Start Kit into your Windows computer, format the FAT partition (wiping out v0.97), then extract Pavel Demin's entire SD Card Image to the root directory.
    • You can get back to a vanilla v0.97 later using images on the Red Pitaya web site .
    • Leave the other hidden partitions on the 4GB micro SD card alone, just format the FAT partition, do not delete or touch any other partitions.
    • Extracting the Zip without first formatting the partition does not work.
    • Installing the v0.94 SDR receiver from the "Marketplace" link instead of from the Zip image does not work.
    • You don't have to use PowerSDR, which I found very hard to use.  HDSDR seems much more intuitive to me.
    • You do not need to install Bonjour to access the Red Pitaya box from Windows; use the Windows command arp -a or your Router interface to find the IP address assigned to the Red Pitaya, then open your browser and enter that IP address as a URL
  3. Just use FreqCalibration=1 in the Skimmer .ini files.  I wasted a lot of time trying to get just the right calibration setting on the highest band, but then it messed up the other bands. Frequency calibration is not consistently "high" or "low" from band to band due varying sampling conversions, and since the Skimmer provides only one calibration setting, it's best to leave it alone.  (Update 2017-07-30:  once the temperature is stabilized with a fan, the FreqCalibration procedure works well.  Set the value to Displayed Frequency / True Frequency, with 8 digits after the decimal point.)
  4. Frequency accuracy got better when I added a small 30mm fan via the plastic case, as recommended.  I did have to crimp on my own 0.1 mm fan connector.  Not well indicated on the board is that the positive pin of the fan connector is the pin closest to the center of the board.
  5. You can calibrate HDSDR very accurately using Options | Calibration Settings while tuned to WWV in EECS (AM) mode with AFC enabled.
  6. With OmniRig support, HDSDR can follow your transceiver's VFO and vice versa (Options -> CAT to radio (Omni-Rig) -> sync from Omni-rig (enable), sync to Omni-Rig (enable)
  7. Use Putty on Windows to get Unix command line access to the Red Pityaa (userid root, password root).
  8. Use the Unix command rdate -sp wwv.nist.gov to accurately set the internal Red Pitaya clock (in UTC) after power up.  Any error logs produced will then be properly time-stamped.  Change the password first, then set the clock.  It may not be possible to automate setting the clock via NTP on v0.95.
  9. Use the passwd command to change the root password.  Unfortunately, the new password is not saved between power cycles in this version of the OS, so it must be reset every time you power up the Red Pitaya. It seems this version uses a RAMDISK, so changes made to local files are not saved between power cycles. :-(
  10. The top command will display the Red Pitaya CPU utilization and memory use.  I never saw the CPU usage exceed 25% when skimming 6 bands at 192 kHz.  Type q to exit and return to the command line.
  11. Type exit to exit from the Unix command line shell
  12. If you open the IP address of the Red Pitaya in your browser, you'll see a nice friendly interface with an "Application Marketplace" link, but that software is not pre-installed on the SD card, it just redirects to http://bazaar.redpitaya.com/, and the SDR Receiver v0.94 on that site is old and does not run at all on v0.95.  DO NOT CLICK INSTALL!  (Update 2017-07-30 -- this actually works fine; I misunderstood that you have to click Install, Run, and keep the next page open to run the SDR receiver manually).
  13. Despite W4KAZ's blog post (http://w4kaz.com/qth/?p=2786), the only SDR receiver build that seems to work with CW Skimmer Server and RTTY Skimmer Server at this time is 0.95 pre-built version.  I think there are still outstanding issues preventing the SDR code from running on any new version of the OS.  (Update 2017-07-30:  all those problems were fixed).
  14. I tried SDR-Console and WINRAD but they are not compatible.  Only HDSDR and PowerSDR worked for me, and only HDSDR works when the Skimmers are running.
  15. The monitor -ams command is documented to display Red Pitaya CPU temperature, but it isn't implemented in v0.95. :-(
  16. Error messages in the Red Pitaya are saved in in /tmp/log/redpitaya_nginx (use the tab key to auto-complete long file names)
  17. Use nano filename to view a log file in a full screen Unix text editor
  18. Press Ctrl-X to exit the editor
73,
Bob, N6TV

W8RKO Eclipse Beacon Station

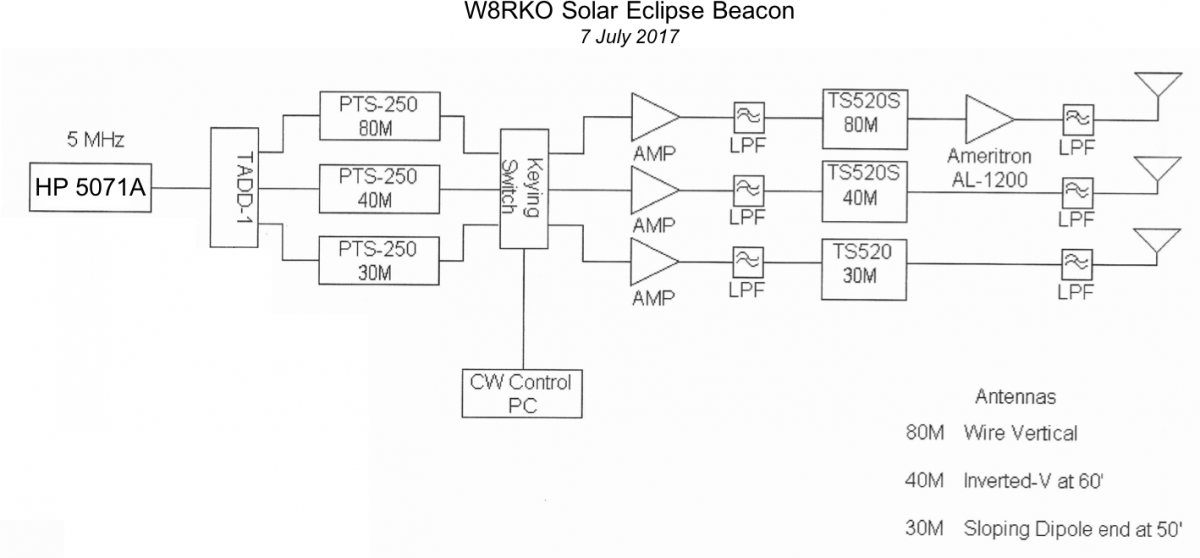
The W8RKO station located in Dayton, OH will transmit three frequencies simultaneously during the beacon period, generated as described below.

An HP 5071A Primary Frequency Standard with "high performance" option provides the reference frequency from which all the signals are derived.  This signal has an absolute accuracy of better than 1 part in 1e13 and short-term noise of less than 5 parts in 1e12.

A TAPR TADD-1 RF distribution amplifier routes the reference frequency to three PTS-250/SX51 low-noise synthesizers, each generating one of the 80M, 40M, or 30M operating frequencies with 0.1 Hz resolution.  The PTS synthesizers are analog designs that introduce no frequency truncation and have very low phase noise.

The synthesizer outputs go into a PC-controlled switch matrix designed and built by W8RKO that provides keying and CW ID.

Following the keyer, the signals are amplified and filtered, then fed into power amplifiers that consist of the driver and final stages of some old Kenwood TS-520S transceivers.  These typically provide about 50W output, and a KW-level amp is available for one band.  The antennas are wires supported from a tower.


w8rko_block_diagram.png

APRS and the Total Solar Eclipse

By Bob Bruninga, WB4APR

The real time packet communications system APRS will be used during the day of the eclipse as a national communications network for those involved in ham radio and eclipse observations to be able to track each other and see where other nearby ham observers are located.  Imagine the APRS map that day showing a clustering of mobile and portable positions all along the totality line.  Please use the station symbol SUNNY for this event so these stations will stand out among all others on the national tracking page http://aprs.fi.

In addition to this position reporting, APRS also supports real-time messaging.  Not only will this be used by individuals for station-to-station texting, there will also be an announcement server that will give everyone national connectivity for announcements. To use it, all one has to do is send an APRS message to ANSRVR and beginning the message with CQ ECLIPSE… Such a message will be sent to every station in the country that has also sent a similar message.

Bob Bruninga, [email protected]

SEQP T-Shirts and Mugs Available

The 2017 Great American Eclipse and the HamSCI Solar Eclipse QSO Party on August 21, 2017 are now just weeks away! This is a great oportunity to both enjoy ham radio and help scientists better understand how the ionosphere works. Are you ready? HamSCI member Ward Silver, N0AX is! He is shown here modeling his new SEQP tank-top and mug. We now have a variety of HamSCI and SEQP T-Shirts and mugs availble through the HamSCI RedBubble store.

These products are made available as a courtesy to the HamSCI community. HamSCI and its members/leadership receive no income from the sale of this merchandise.

Non-Ham Participation in Observing the Eclipse's RF Effects

By Ward Silver, N0AX

If you are not a ham radio licensee - how can you participate in monitoring the eclipse?  Perhaps you are looking for a demonstration of the impact the eclipse will have on radio signals.  Maybe you are looking for an experiment that a group can perform without specialized equipment.  Regardless of your background, this article from the July issue of Nuts and Volts magazine explains the eclipse's effect on radio propagation without too much technical detail.  You can use an AM radio or World Band radio in several ways that are sure to demonstrate what happens when the Sun's ray are blocked from the Earth's atmosphere.  You can log the observed effect on signals or you can just listen while you're watching the eclipse unfold.  The article shows you easy ways to experience the eclipse in a whole new way and it may pique your interest in getting involved with radio science as a career or a hobby.

Link to Nuts & Volts article: http://www.nutsvolts.com/magazine/article/the-solar-eclipse-and-ham-radio

2017 Eclipse HF Wideband Recording Experiment

Please bookmark this page and join the HamSCI-Eclipse mailing list for further announcements.
Total solar eclipses are known to cause changes to the ionosphere and high frequency propagation. During the 2017 American Total Solar Eclipse, numerous HF radio sources will be on the air to help study these effects. We request that amateur radio stations capable of making wideband (e.g., 192k or higher sample rate) digital HF recordings participate in this experiment and publish their data to the HamSCI community on the open-data sharing site zenodo.org.
 
Research Question
  • How does the 2017 Total Solar Eclipse affect HF propagation paths?
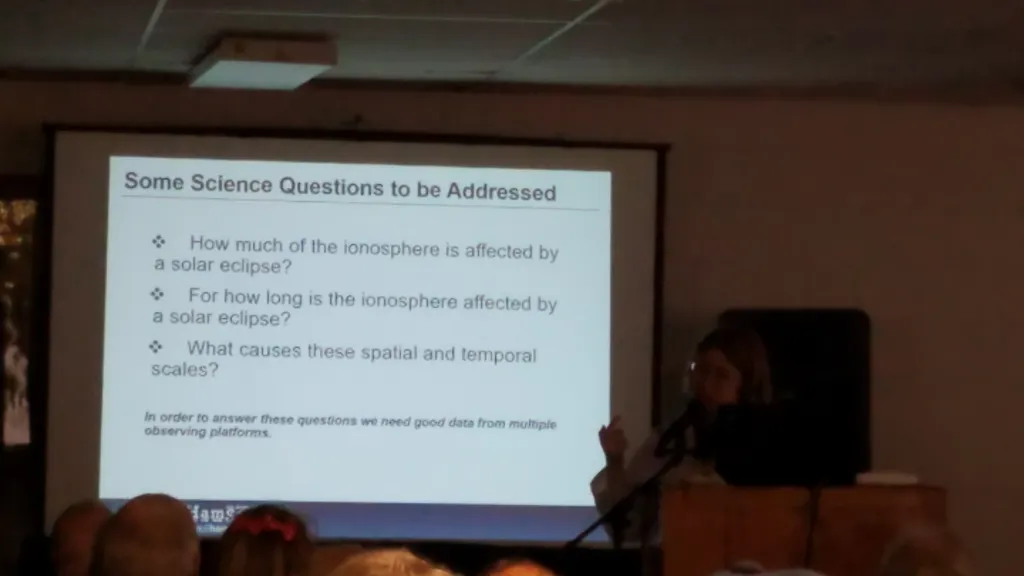
  • How much of the ionosphere is affected by a solar eclipse?
  • For how long is the ionosphere affected by a solar eclipse?

Objective

  • Observe changes in HF propagation caused by the eclipse by making recordings of large portions of the HF band from multiple locations, most importantly across the North American continent.
  • Provide wideband recordings of HF spectra to support SEQP log/RBN/PSKReporter/WSPR data.

Times

  • 21 August 2017, 1400 – 2200 UTC
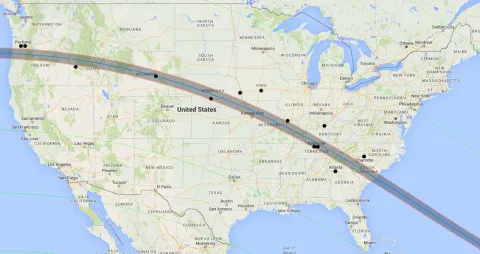
Note: Partial eclipse begins 21 Aug 2017 at about 1600 UTC in Oregon ends at 21 Aug 2017 at about 2015 UTC in South Carolina.

Frequencies

Please prioritize recording of frequencies that correspond with Solar Eclipse QSO Party (SEQP) operation, especially the lower frequencies, as these should see the largest eclipse effect. This consists of the standard HF contest bands (see table below). In addition, we welcome observations from as much of the LF, MF, and HF spectrum as possible. The capabilities of different HF receivers vary widely, and some modern HF SDRs are capable of multiple slice receivers. Note that it is possible to simultaneously make wideband recordings and act as a RBN skimmer node. See N6TV's How-To Guide for Running a Combined CW-RTTY Red Pitaya Skimmer for instructions on how send SDR data streams to multiple programs simultaneously.

Solar Eclipse QSO Party (SEQP) Frequencies

Band Frequency
160 m 1.800 - 2.000 MHz
80 m 3.500 - 4.000 MHz
40 m 7.000 - 7.300 MHz
20 m 14.000 - 14.350 MHz
15 m 21.000 - 21.450 MHz
10 m 28.000 - 29.700 MHz

Procedure

You may use any radio and software that is capable of generating IQ recordings of HF spectrum that can be properly time-stamped and frequency-stamped. We recommend using MIT Haystack's Digital RF software for this purpose, as it is will record observations to the proper IQ format and provide the required time- and frequency- stamping.

A number of SDR radio and software combinations allow real-time wideband recording of the HF spectrum.  The spectrum width that can be recorded is usually a bit less than the radio sample rate.  For example, a 384k sample-per-second receiver can record around 375 kHz of bandwidth, which is enough to include the entire 40, 30, or 20M band.  A number of SDR receivers, including RTL-SDR "dongles", Red Pitaya, and "HPSDR" compatible radios such as the Anan 10/100/200 series and the original Hermes board, are capable of this.

An Open Source Software script using GNU Radio under Linux will shortly be available through TAPR that allows receiving and recording four bands simultaneously with HPSDR or six with the Red Pitaya hardware.  (Note that multiple receivers will require a fairly fast PC such as an i7 with solid-state disk; using fewer receivers reduces the computer resources needed.  Check https://github.com/TAPR for updates.

We encourage you to make the most careful measurements possible. If you are capable of stabilizing your receiver with a high-stability frequency reference or provide amplitude calibration characteristics for your system, please do so. You may describe your methodology in the Zenodo Data Description box and upload supporting documents if necessary (such as block or antenna pattern diagrams).

Uploading to Zenodo

We ask that all data generated by this experiment be uploaded to the HamSCI community on zenodo.org. By uploading to zenodo.org, a permanent, citable, centralized record of the data that is openly available to both researchers and the general public will be created. 
 
To upload your data create an account on https://zenodo.org. You can create a login using your github account or via their account creation. Once you have an account and you are logged into the service visit “https://zenodo.org/deposit/new?c=hamsci”. Select your file(s), click “Start Upload”, select “Dataset” as your upload type, fill in all relevant information regarding contributors, and finally click "Save" and then “Publish” in the bottom right.

Data Files

Please submit the following items:

  • IQ File for each band recorded (Will be encapsulated in a HDF5 file if using MIT's Digital RF)
  • Supporting data files (i.e. any files needed to help interpret the raw data, such as a block diagram of the receive station)

Use the <Callsign>_wideband_<start_freq>_<stop_freq>kHz_<YYYYMMDD>_<HHMM>UT.<ext> filename convention for uploaded where HHMM is the UT start time of that particular file. Examples:

  • K2MFF_wideband_3500_3692kHz_20170821_1400UT.hd5 (for a HDF5 IQ recording  of 3500-3692 kHz made at K2MFF on 21 Aug 2017 starting at 1400 UT)
  • K2MFF_wideband_supporting_20170821_1400UT.pdf (for a PDF of supporting material to help in interpreting the data)

Data Description

In the data description box, please include:

  • Your Name and Call Sign
  • Latitude and Longitude of the Recording(s)
  • A description of station hardware configuration, including
    • Antenna type
    • Antenna pointing direction (if applicable)
    • Receiver type
  • Any other information you believe would be necessary for proper scientific interpretation of your measurements

Data Notes

In the Notes box, you may include your personal comments regarding your observations.

Too Much Data?

Zenodo accepts up to 50 GB per data set. If necessary, please upload each band recording as a separate dataset. If this method is not feasible, please contact [email protected] and we will find another way to transfer the data.

Data License

Please license your data as:

  • Open Source
  • Creative Commons Attribution 4.0

Thanks!

Thank your for your time and effort in participating in this experiement!


Page Contributors: W2NAF, N8UR

Last Edited: 15 August 2017

Eclipse AM Broadcast Reception Experiment

Contributing author Joe Rao of Sky & Telescope Magazine is asking readers to submit reception reports of AM broadcast stations heard during the upcoming August 21, 2017 Total Solar Eclipse. The shadow of the moon is expected to cause a depletion in the D region of the ionosphere, thereby reducing ionospheric absorption in the AM broadcast band (540 - 1700 kHz) and allowing for long-distance skywave propagation. This same mechanism allows for long-distance propagation of AM broadcast stations at night. This is an excellent eclipse radio experiment for people who do not have ham radio licenses or access to specialized equipment. For more information, please see Joe's Sky & Telescope article.

For more on Joe Rao:

  • https://twitter.com/JoeRaoWeather
  • https://www.facebook.com/JoeRaoWeather/

Figure: Map of clear channel AM broadcast stations in or near the August 21, 2017 eclipse totality. Eclipse map by Xavier Jubier.

2017 Eclipse HF Frequency Measurement Experiment

Please bookmark this page and join the HamSCI-Eclipse mailing list for further announcements.
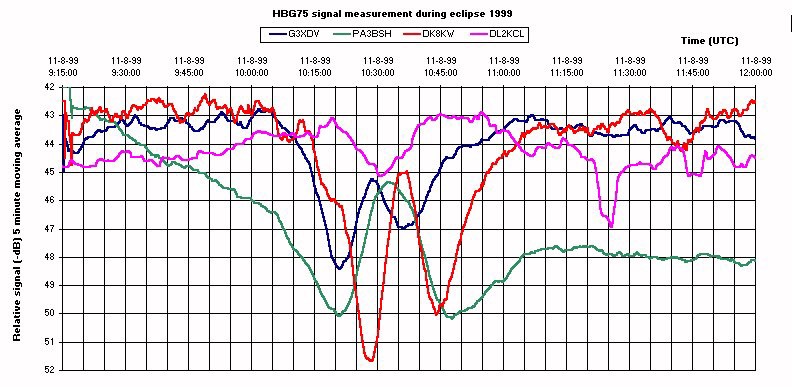
Rapid changes in ionospheric electron density caused by the motion of the shadow of an eclipse is known to cause Doppler shifts on HF ray paths propagating through the eclipse region. For example, see Figure 7 in Boitman et al., 1999. We request that all amateur radio stations capable of making high-quality HF frequency measurements participate in this experiment and publish their data to the HamSCI community on the open-data sharing site zenodo.org.
 

Research Question

  • How does the 2017 Total Solar Eclipse affect HF propagation paths?

Objective

  • Measure HF path Doppler shifts caused by the motion of the eclipse shadow across the ionosphere.

Times

  • Control Day: August 20, 2017, 1400 – 2200 UTC
  • Eclipse Day: August 21, 2017, 1400 – 2200 UTC
Note: Partial eclipse begins 21 Aug 2017 at about 1600 UTC in Oregon ends at 21 Aug 2017 at about 2015 UTC in South Carolina.

Beacons

WWV in Fort Collins, CO
  • 2.5 MHz
  • 5 MHz
  • 10 MHz
  • 15 MHz
  • 20 MHz
  • 25 MHz

WWV.png


CHU in Ottawa, Ontario, Canada
  • 3.330 MHz
  • 7.850 MHz
  • 14.670 MHz

CHU.png

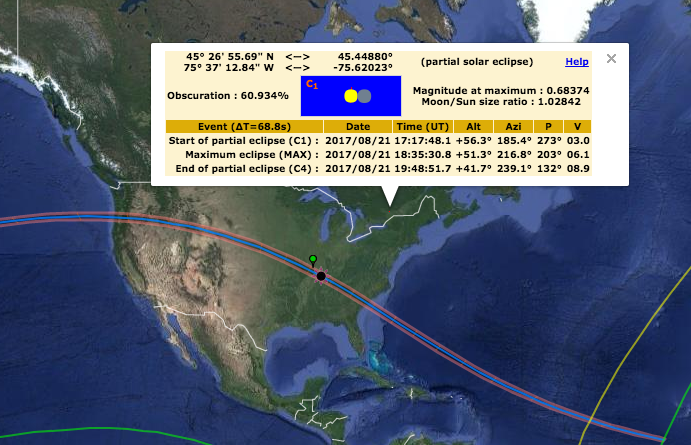
Created with Xavier Jubier's Eclipse Map

Receivers

Any and all observations that can unambiguously measure the characteristics of the beacon signal are welcome. Recommendations for participation are listed below; please choose an option that matches your interest, equipment capabilities, and skill level.
  • To make narrow-band, precision frequency observations of the beacons, we recommend following the instructions on the Spectrum Lab Solar Eclipse Instructions Page. Please note that we understand that there are multiple ways of making accurate Doppler shift measurements. Please feel free to use an alternative procedure as long as it is technically sound and can adequately describe the procedure you used in your final data submission so that others will be able to properly interpret your measurements.
  • Receive stations south of the eclipse path should monitor CHU, while receive stations north of the eclipse path should monitor WWV. This will ensure that the signal path crosses the eclipse. You can find your location relative to the eclipse path with Xavier Jubier's Eclipse Map.
  • Measure as many frequencies as you are able continuously and simultaneously.
  • Do not frequency-hop or otherwise alternate between frequencies.
  • The greatest effect is expected at the lowest frequencies, therefore prioritize measuring the lowest frequencies.

Uploading to Zenodo

We ask that all data generated by these experiments be uploaded to the HamSCI community on zenodo.org. This includes observation period data from the control day and the eclipse day. By uploading to zenodo.org, a permanent, citable, centralized record of the data that is openly available to both researchers and the general public will be created. 
 
To upload your data create an account on https://zenodo.org. You can create a login using your github account or via their account creation. Once you have an account and you are logged into the service visit “https://zenodo.org/deposit/new?c=hamsci”. Select your file(s), click “Start Upload”, select “Dataset” as your upload type, fill in all relevant information regarding contributors, and finally click "Save" and then “Publish” in the bottom right.
 
Here is an example completed Zenodo FMT upload: https://doi.org/10.5281/zenodo.834948

Data Files

For each observation period, please submit the following items:

  • Raw Audio Recording(s)
  • Processed Spectrum Lab Text File(s)

Use the <Callsign>_<freq>kHz_<YYYYMMDD>_<HHMM>UT.<ext> filename convention for uploaded where HHMM is the UT start time of that particular file. Examples:

  • K2MFF_2500kHz_20170821_1400UT.wav (for an audio recording made at K2MFF on 2500 kHz on 21 Aug 2017 starting at 1400 UT)
  • K2MFF_2500kHz_20170821_1400UT.txt (for a Spectrum Lab data file made at K2MFF on 2500 kHz on 21 Aug 2017 starting at 1400 UT)

Data Description

In the data description box, please include:

  • Your Name and Callsign
  • Latitude and Longitude of the Recording
  • Start time of the WAV file
  • A description of station hardware configuration, including
    • Antenna type
    • Antenna pointing direction (if applicable)
    • Receiver type
    • Frequency reference type
    • Frequency measurement technique
  • Any other information you believe would be necessary for proper scientific interpretation of your measurements

Data Notes

In the Notes box, you may include your personal comments regarding your observations.

Data License

Please license your data as:

  • Open Source
  • Creative Commons Attribution 4.0

Page Contributors: WA9VNJ, N8UR, W8RKO, W2NAF, KD2JAO, KM4EGE

Last edit: 10 August 2017

Spectrum Lab Solar Eclipse Instructions Page

SL-spectrogram.png

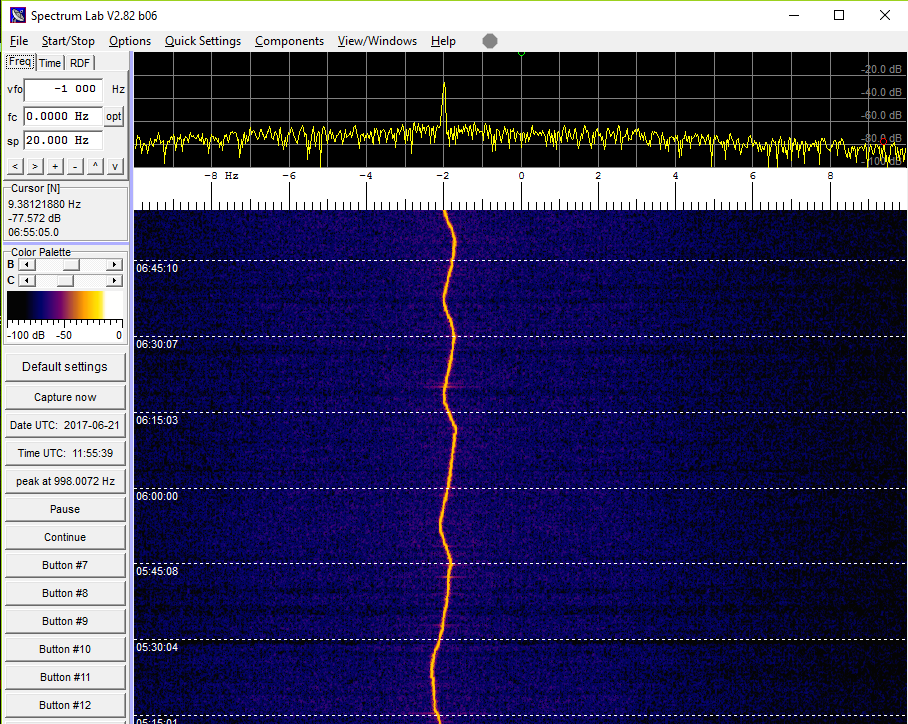
Figure 1: An example of Spectrum Lab tuned 1 kHz below a local AM radio broadcast station.  The “vfo” option is set to -1000 Hz to center the graph at zero. Note this setting does not affect logged data, which will show up near 1000 Hz.  The station is about 2 Hz low and varying.  Monaural audio is saved to a WAV file and spectrum calculations to a text file.  The time on the graph is CDT hours, but the time in the file is UTC.
 
Please note that we understand that there are multiple ways of making accurate Doppler shift measurements. Please feel free to use an alternative procedure as long as it is technically sound and can adequately describe the procedure you used in your final data submission so that others will be able to properly interpret your measurements.

Objectives

This page provides recommended procedures for using the Spectrum Lab software to make observations during the 2017 Total Solar Eclipse. Upon successful configuration, Spectrum Lab will generate:
  1. Text file containing derived spectral measurements
  2. Raw audio WAV file

Requirements

Radio Configuration

Choose one of two options:
  1. Set the radio to USB mode tune it 1 kHz below the signal to be measured. You will hear a roughly 1 kHz tone.  The frequency will be affected by the ionosphere, the DDS error in the receiver, and sample rate error. 
  2. Set the radio to AM mode and tune it to the frequency of the signal to be measured. Mix in a local oscillator set to 1 kHz below this frequency. This measured frequency in this method will be affected by the ionosphere, the sample rate error, but not the DDS error in the reciever.

Spectrum Lab Configuration

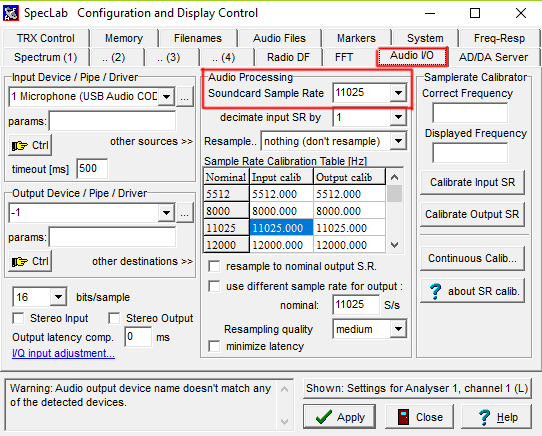
  1. Configure Spectrum Lab to sample audio at 11025 Hz.

SL-audio.png

Figure 2: Spectrum Lab Audio I/O settings.

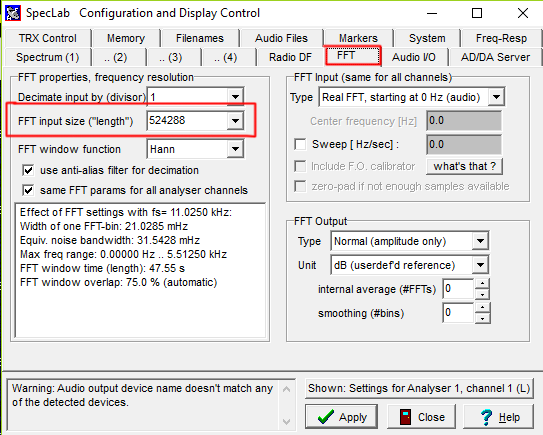
  1. Configure Spectrum Lab to compute 512k-point FFTs.

SL-FFT.png

Figure 3: Spectrum Lab FFT settings.

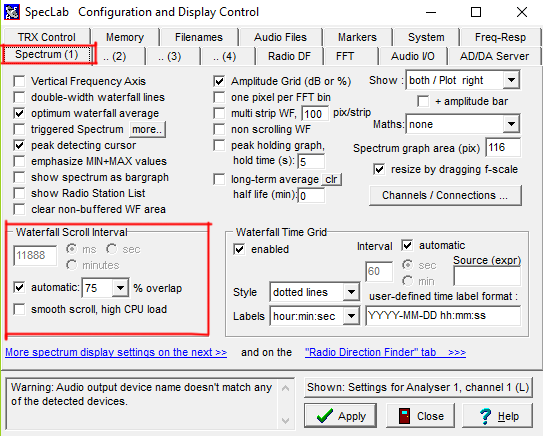
  1. Configure Spectrum Lab to overlap FFTs in time, producing a new FFT every 12 seconds.

SL-overlap.png

Figure 4: Spectrum Lab spectrum settings.

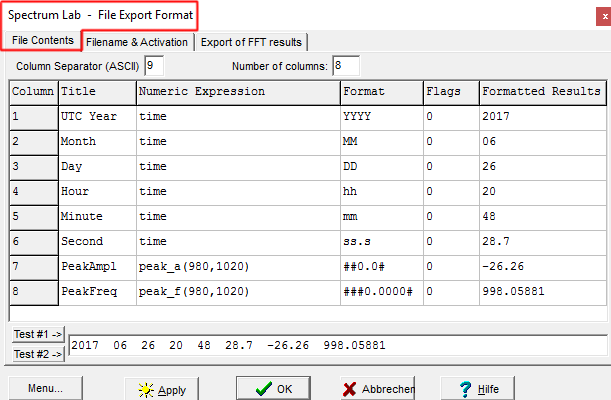
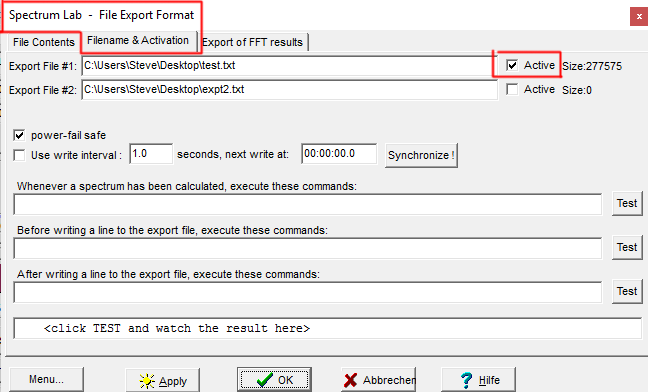
  1. Configure the processed file output parameters of Spectrum. To do this, go to File --> Export FFT and make your settings match those in Figure 5.

SL-file.png

Figure 5: FFT file contents settings.

  1. Enable saving of the processed data file.

SL-file-enable.png

Figure 6: FFT filename settings.

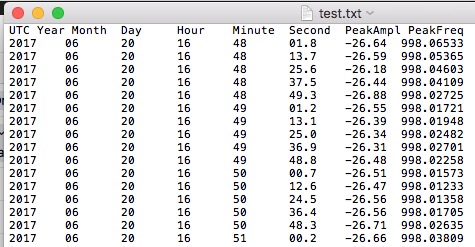
    SL-spec-example.jpg

    Figure 7: Example FFT file.

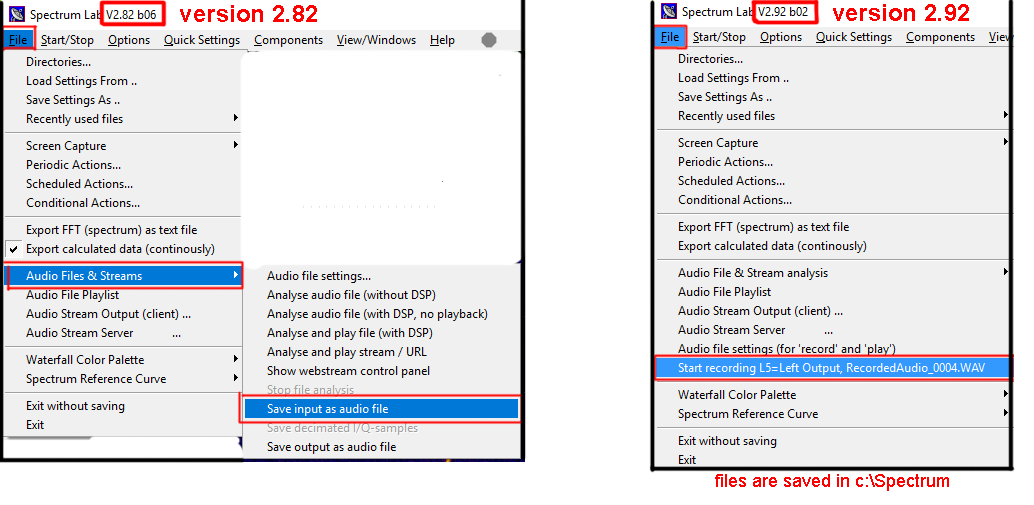
    1. Enable streaming/saving to a WAV audio file:

    SL-audio-file.png

    Figure 8: Enabling streaming/saving to a WAV file.


    Page Contributors: WA9VNJ, W2NAF
    28 July 2017

      MIT Haystack Observatory Releases Software Toolkit for Scientific SDR Use

      Editor's note: This toolkit can be used to record SDR data to a standard format for scientific use.

      MIT Haystack Observatory is pleased to announce the formal open source release of Digital RF version 2.5 under a BSD license. The software implements a data recording format for scientific radio frequency (RF) instrumentation using the HDF5 scientific data format. The implementation is designed for the management of highly time-dependent data from a large number of radio sensors. Applications include radio science (e.g., radio astronomy, geospace radar) and any project requiring the capture and use of RF data as raw digital samples.


      Key Digital RF features include:

      1. Data are written in a very deterministic way that allows for both high-speed linear recording of data and O(1) read-back of arbitrary data intervals.
      2. Consistent metadata is provided and a sub-library offers a robust means of creating time-dependent metadata to annotate the raw RFdata.
      3. Tools, examples, and interfaces are provided to demonstrate use of the software and to allow basic manipulation and visualization of the data.
      4. The Haystack Observatory Recorder (thor) is provided as a data recording example for use with Ettus software radios (i.e., X300, N200, B210, B200mini).
      5. The core implementation is written in the C programming language with a Python wrapper.
      6. A MATLAB interface is provided for reading data.
      7. An interface to popular software radio systems is provided through a plugin for the GNU radio framework.

      This work was supported by the National Science Foundation under the Geospace Facilities and MRI programs, and by National Instruments/Ettus Corporation through the donation of software radio hardware. We are grateful for the support that made this development possible.

      Digital RF is available on GitHub:

      https://github.com/MITHaystack/digital_rf

      We hope you find the software useful and can contribute to its future development. For discussions related to Digital RF, please use our mailing lists ([email protected] and [email protected]).

      Regards,

      Frank Lind, Bill Rideout, Juha Vierinen, Ryan Volz, John Swoboda, and Phil Erickson
      (via Nancy Kotary)

      -----
      MIT Haystack Observatory
      Westford, Massachusetts 01886 USA
      [email protected]

      e-POP Spacecraft to Participate in 2017 ARRL Field Day

      By G. W. Perry, N. A. Frissell, E. S. Miller, and J. D. Katz

      The Enhanced Polar Outflow Probe (e-POP) onboard the Canadian CAScade Smallsat and Ionospheric Polar Explorer (CASSIOPE) satellite will once again be supporting ham radio citizen science by participating in the 2017 American Radio Relay League Field Day, on June 24 and 25, 2017.

      On an annual basis, the ham radio community participates in the ARRL Field Day to exercise and hone their skills in the field.  In essence, it is an emergency preparedness exercise – one of the largest anywhere – with several thousand hams taking part across the world.  From a radio science perspective, Field Day is an ideal time for e-POP to study the structure of the Earth’s ionosphere using Field Day participants’ transmissions.

      Launched in September 2013, e-POP is one of two payloads on the CASSIOPE spacecraft; the other is a commercial high-capacity data courier technology demonstration.  e-POP is a suite of eight science instruments with an objective of studying the ionosphere and space weather effects.  The spacecraft’s mission and science operations are headquartered at the University of Calgary, and its operations are funded by the European Space Agency (ESA).  More information about e-POP can be found at https://epop.phys.ucalgary.ca.  One of e-POP’s instruments is the Radio Receiver Instrument (RRI), a digital receiver with four 3 m monopole antennas, with a scientific objective of studying natural and artificial radio emissions from 10 Hz to 18 MHz.  RRI’s monopoles can be electronically configured into a crossed-dipole setup.  RRI has two data channels – one for each dipole.  Each channel is sampled at 62.5 kHz, and passed through a 30 kHz bandpass.

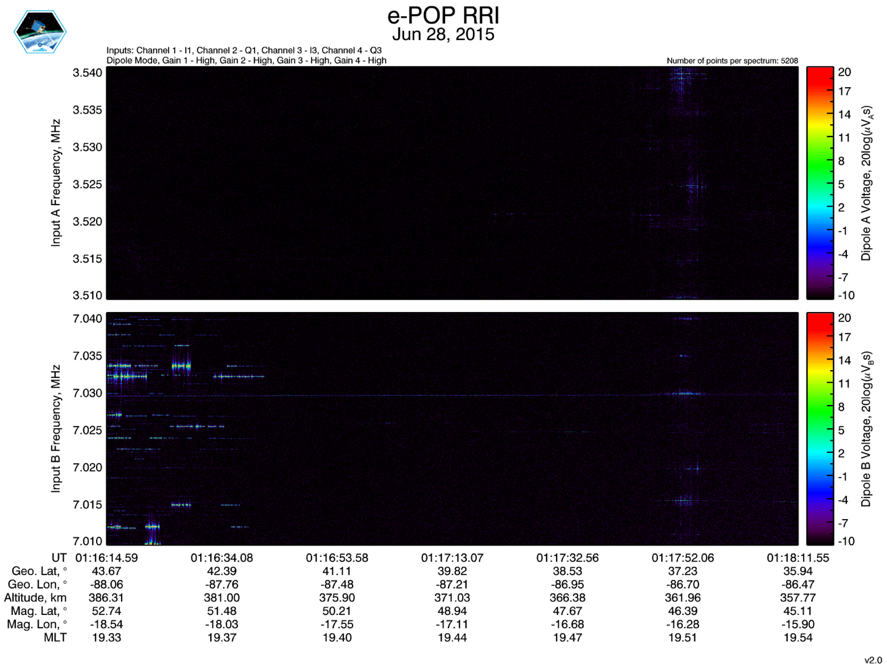
      During the 2015 ARRL Field Day on June 28, 2015, RRI was activated for two minutes, starting at 1:16 UT, while e-POP was just north of Milwaukee, on a southeasterly heading.  RRI was in a crossed-dipole configuration: its two channels were tuned to 3.525 and 7.525 MHz, respectively.  A spectrogram (similar to "waterfall display") of the entire 2-minutes of data is shown in Figure 1 (a presentation summarizing the results is available for download).  What is most striking about the observations is that, not only are CW ham radio transmissions clearly seen at 40 m (Channel B), but that they are only observed for about the first 30 seconds, even though data from the Reverse Beacon Network (RBN) show that those ham operators continued transmitting throughout the entirety of the experiment.  

      A science article is currently being prepared by Dr. Gareth Perry and colleagues in the HamSCI community to report the experiment and the characteristics of the received signals.  It is not surprising that signals were not received on the 80 m band (Channel A).  Those transmissions should – theoretically – not have been able to penetrate the ionosphere and propagate to RRI during the experiment.  On the other hand, transmissions on the 40 m band were able to do just that.  These signals can be used to study HF radio wave propagation.  The advantage of using the ham community’s transmissions is that since each user’s call sign is coded in their call, the source of the signal can be identified.  This allows the point of origin of each signal to be identified, input into a HF ray trace model, and then used to the elucidate the properties of the ionosphere during the experiment.  During the 2015 Field Day, 23 call signs were identified.  The hypothesis that Dr. Perry and colleagues are investigating is that is that the ham signals disappeared as the spacecraft headed south, into latitudes where the ionosphere was denser and blocked the transmissions.


      20170614_article_epop_fieldday_spectrum.png

      Figure 1: RRI spectrogram from 2015 Field Day activities.  Ham radio CW transmissions were only detected on the 40 m band (Channel B, bottom panel) for the first 30 seconds of the experiment. No signals were detected on the 80 m band (Channel A, top panel).

      For the 2017 Field Day, e-POP will be dedicating all of its resources to studying HF radio wave propagation using ham radio transmissions.  RRI will be once again tuned to the CW bands at 40 and 80 m; however, the exact tuning frequencies have not yet been determined.  RRI is scheduled to be activated 6 times, in 10 minute increments, over the Field Day weekend.  Below is a table of approximate RRI operations times over Canada and the United Sates.  All 2017 Field Day participants are encouraged to transmit on the 40 and 80 m bands during these times.

      The results of the 2015 e-POP ARRL Field Day were serendipitous, even if only 2 minutes of data was collected.  The data from the upcoming Field Day is sure to offer even further insight into the intricacies of HF radio wave propagation and increase the applicability of citizen radio science in the “traditional” academic radio science methodologies.  We’re looking forward to hearing from you!


      Pass Number

      Date

      Pass Time (UT)

      e-POP altitude (km)

      Pass Direction

      Region

      1

      June 24

      22:32 – 22:42

      800

      NS

      East Coast

      2

      June 25

      00:13 – 00:23

      800

      NS

      Central

      3

      June 25

      01:54 – 02:04

      800

      NS

      West Coast

      4

      June 25

      11:35 – 11:45

      1350

      SN

      East Coast

      5

      June 25

      13:17 – 13:27

      1350

      SN

      Central


      Red Pitaya Multiple Antennas

      When using Pavel Demin's six-band receiver for the Red Pitaya, it is is possible to assign each receiver to either the IN1 or IN2 ports. This allows antennas for different bands to be used.

      This can be configured by modifying the command line parameters in /sbin/discovery.sh on the Red Pitaya SD card. In the following example, the first three receivers are connected to IN1 and last three receivers are connected to IN2:

      /opt/redpitaya/bin/sdr-receiver-hpsdr 1 1 1 2 2 2 &

      Dayton Hamvention HamSCI Photos and Videos

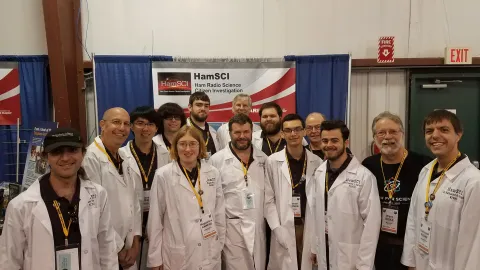
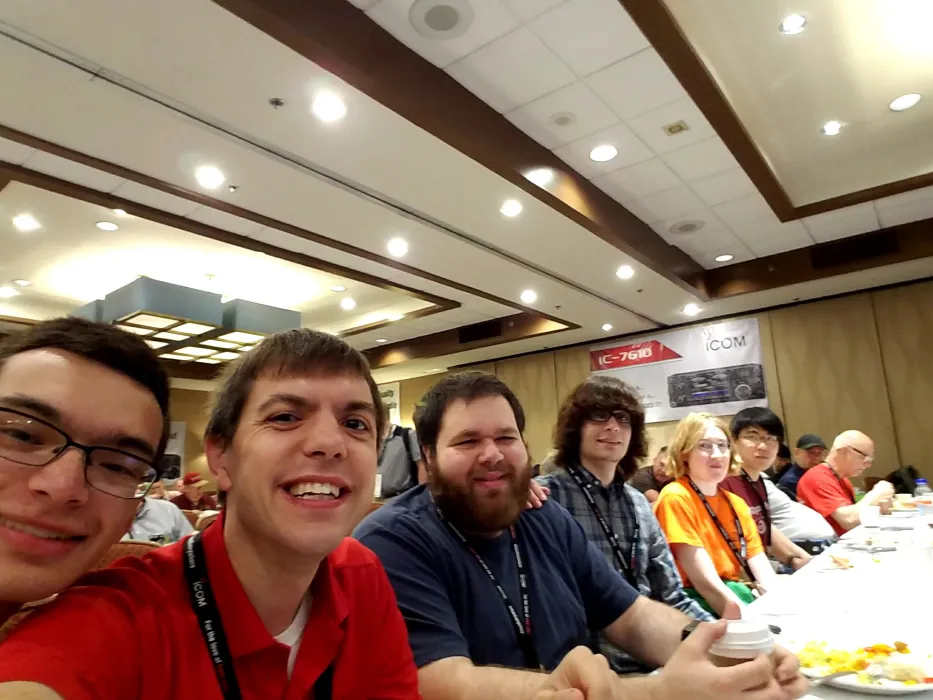
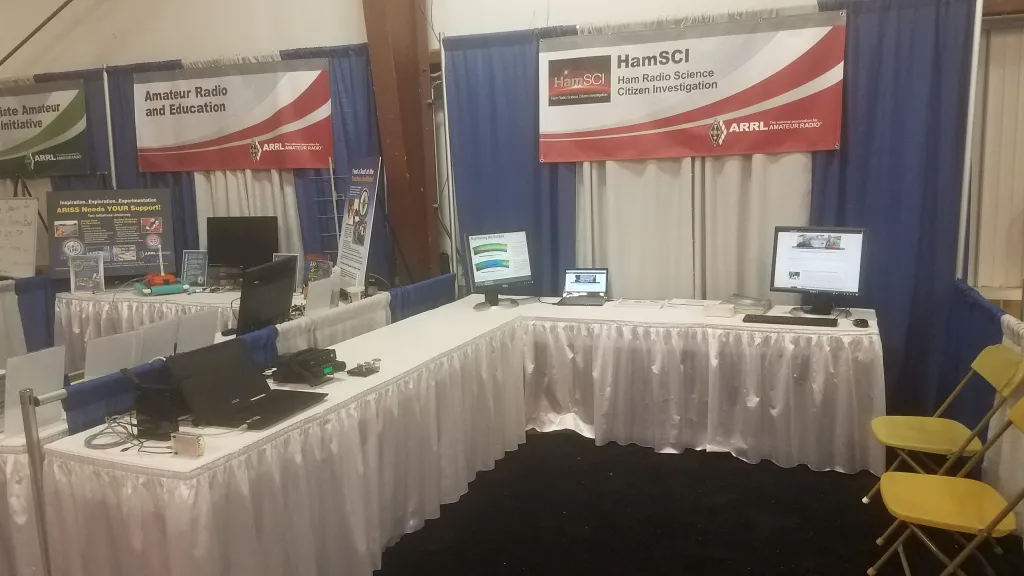
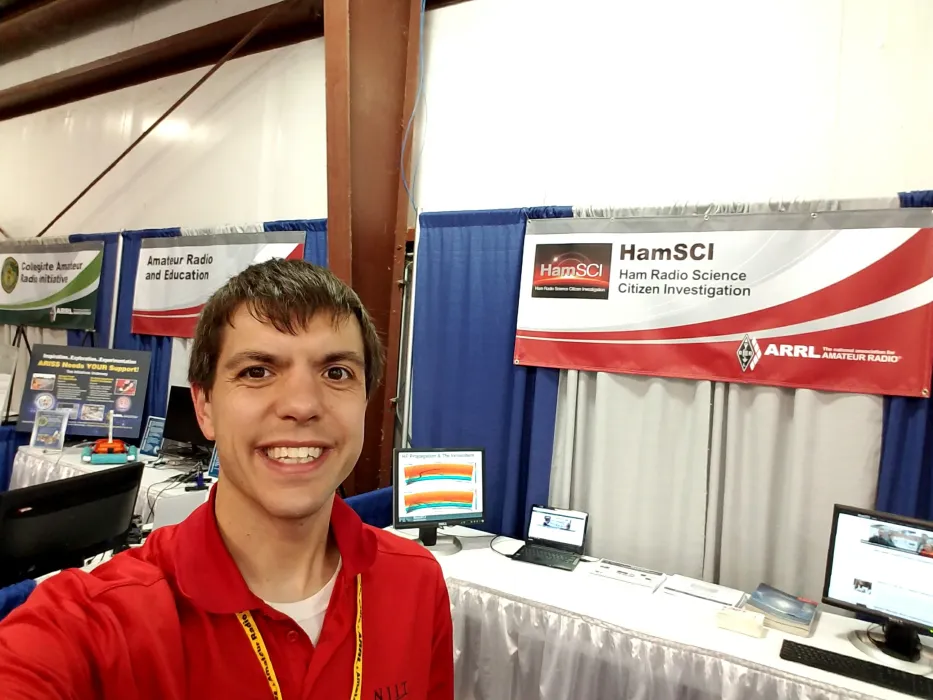
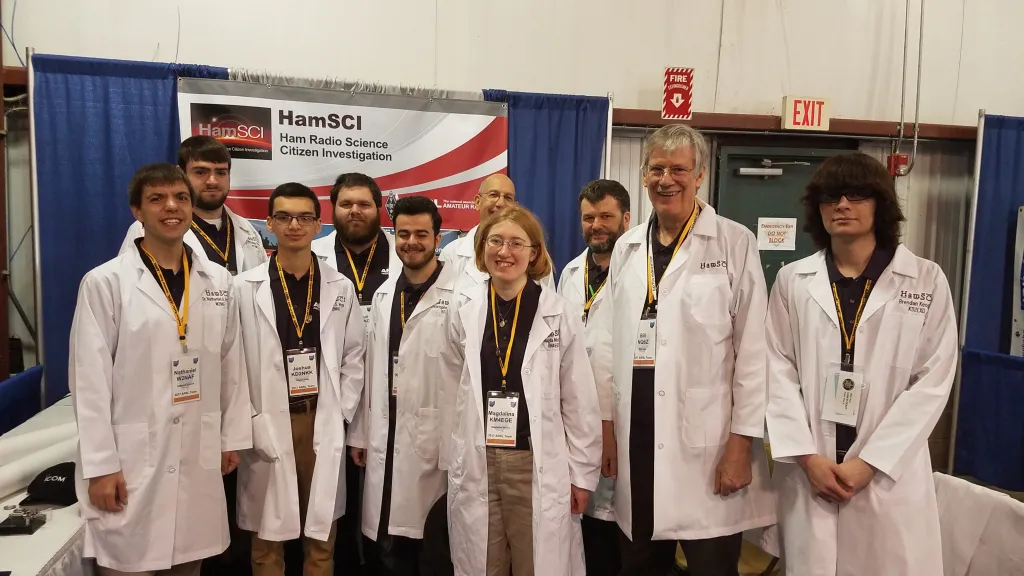
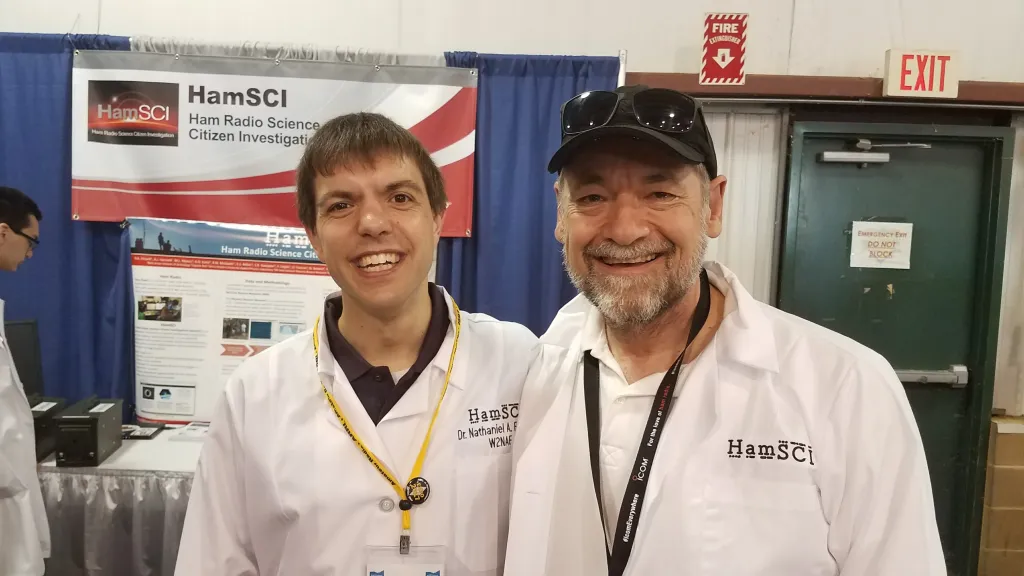
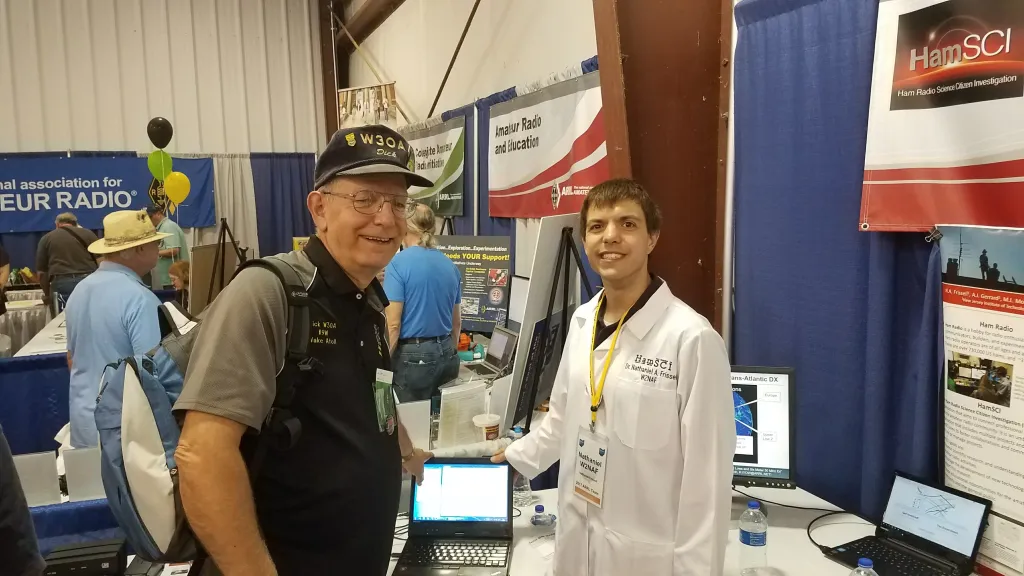
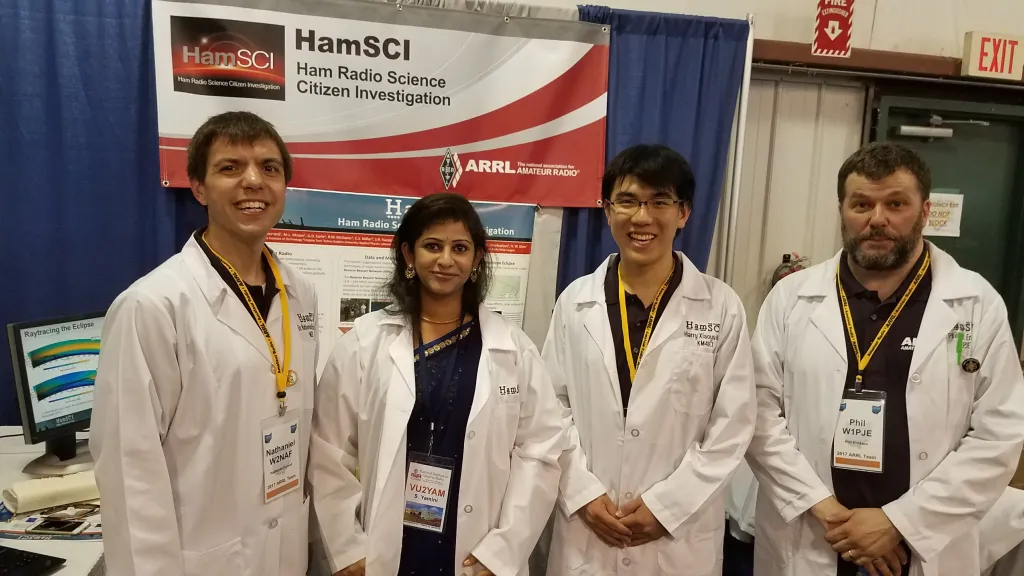
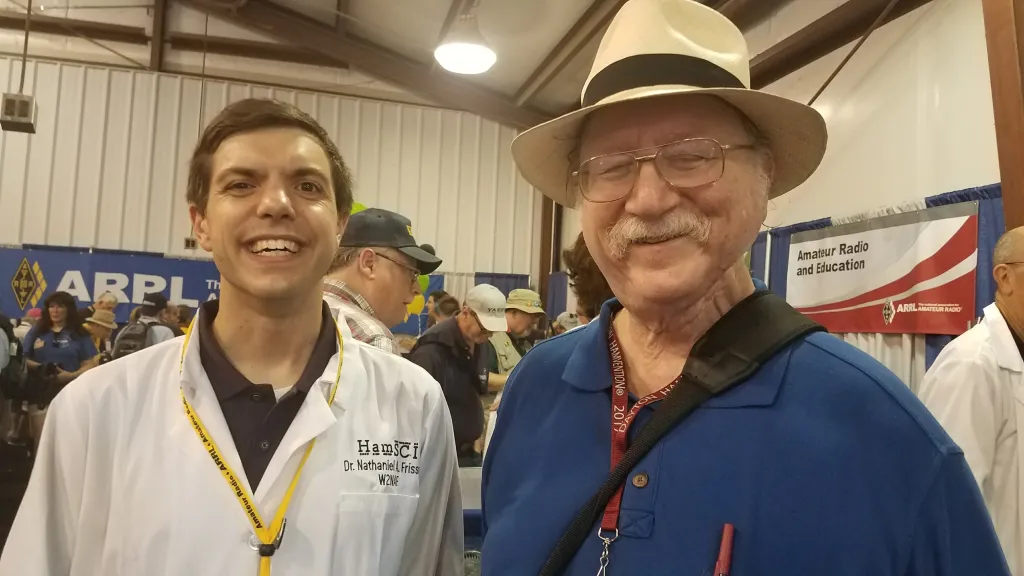
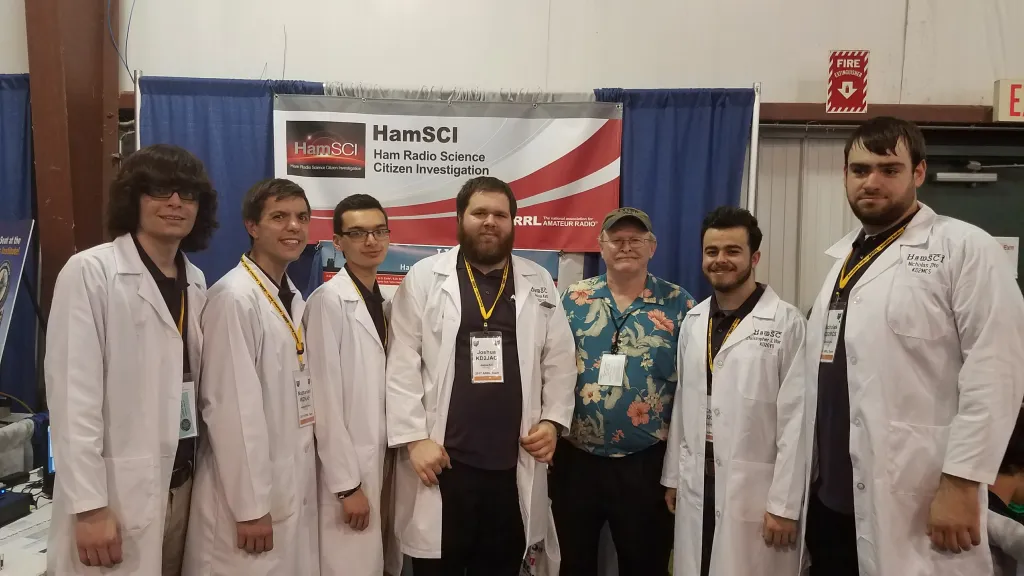
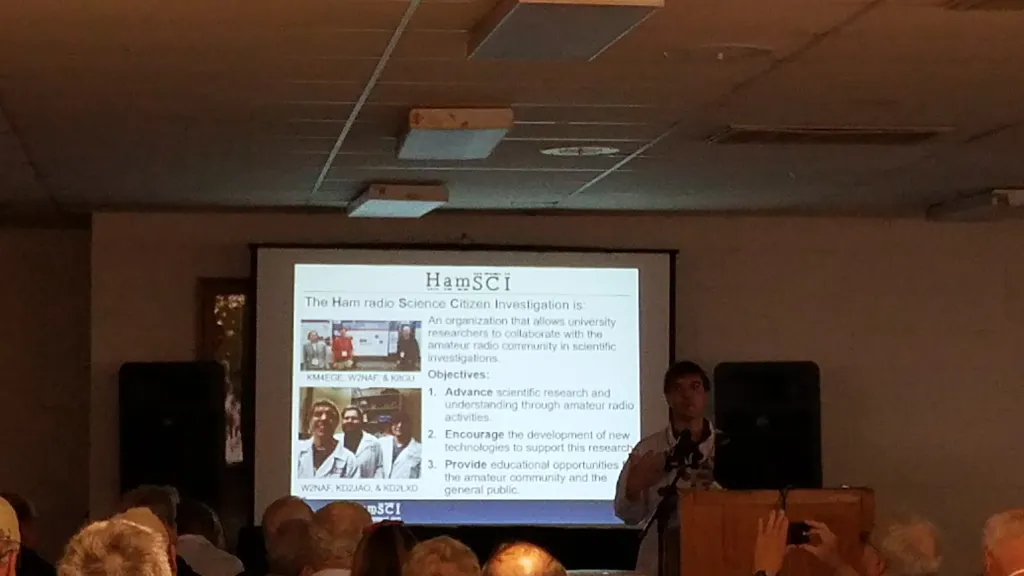
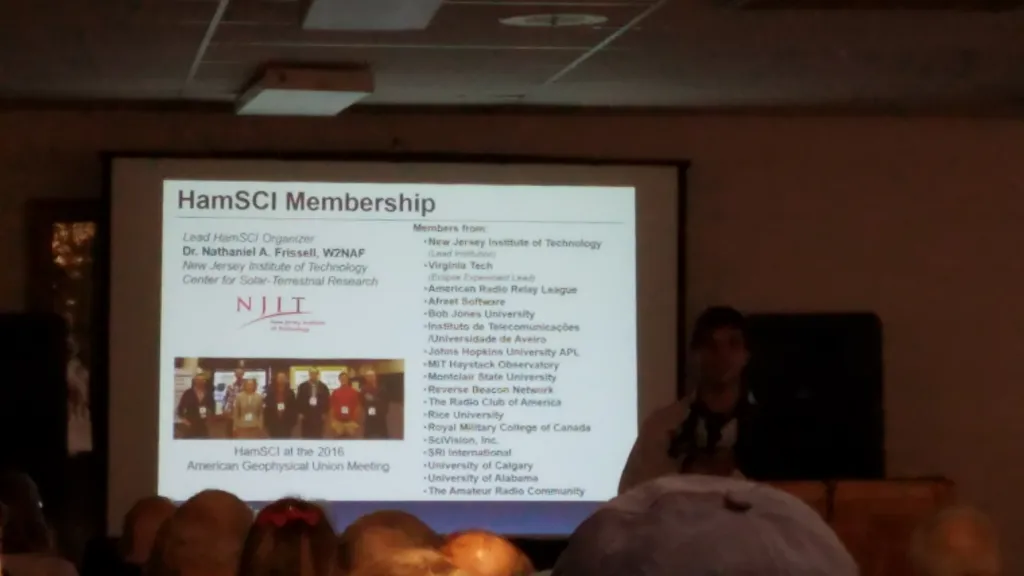
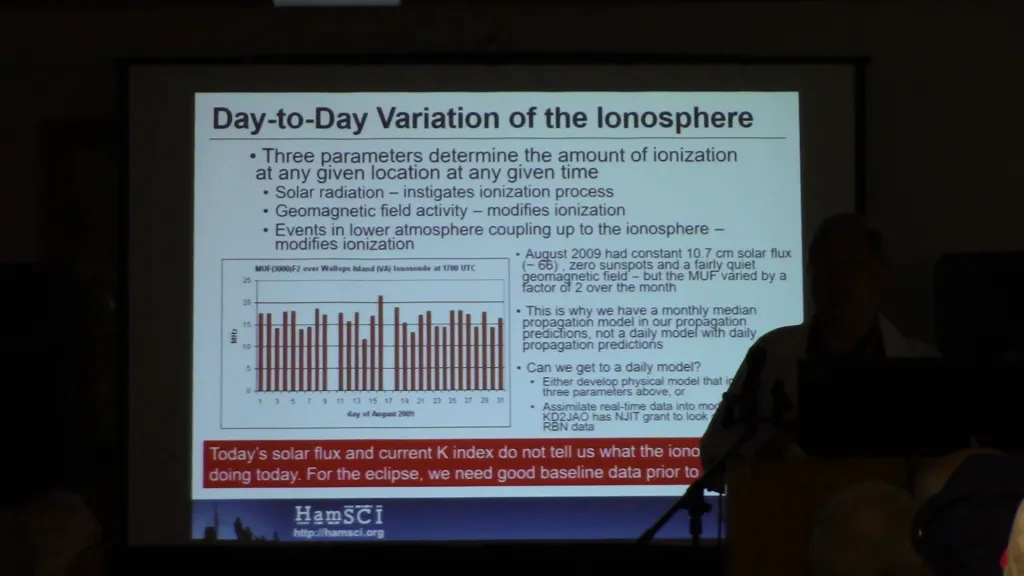
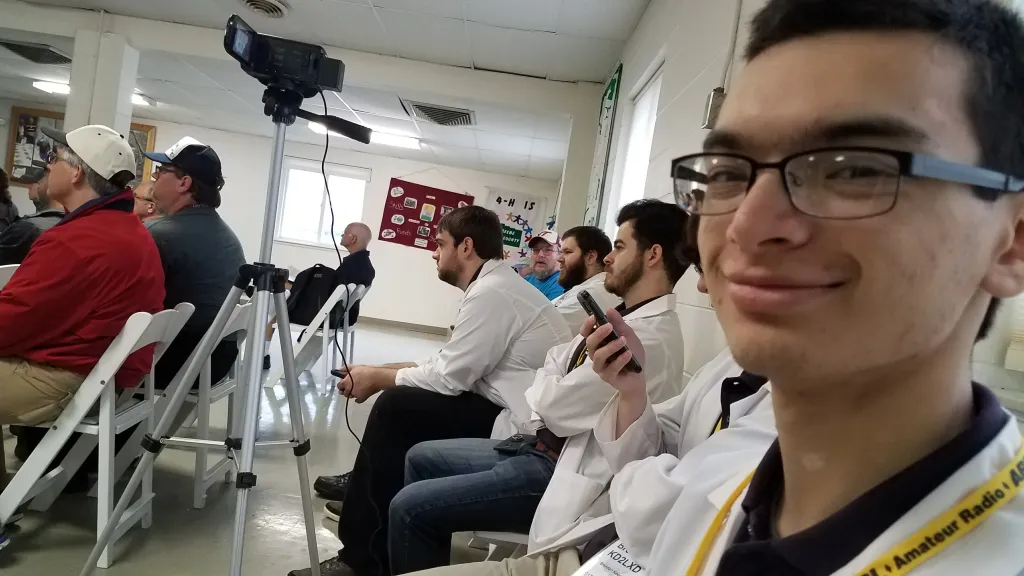
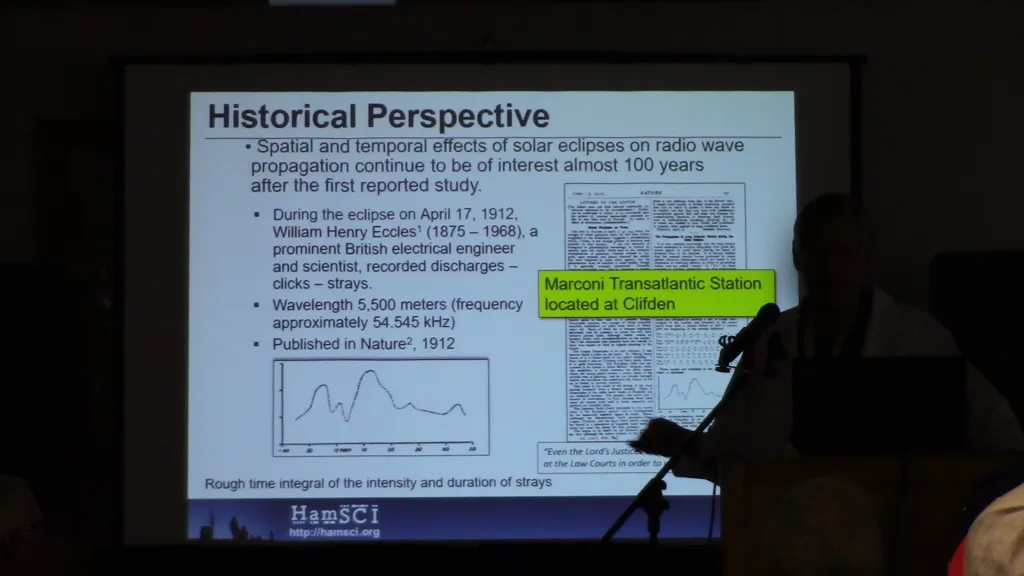
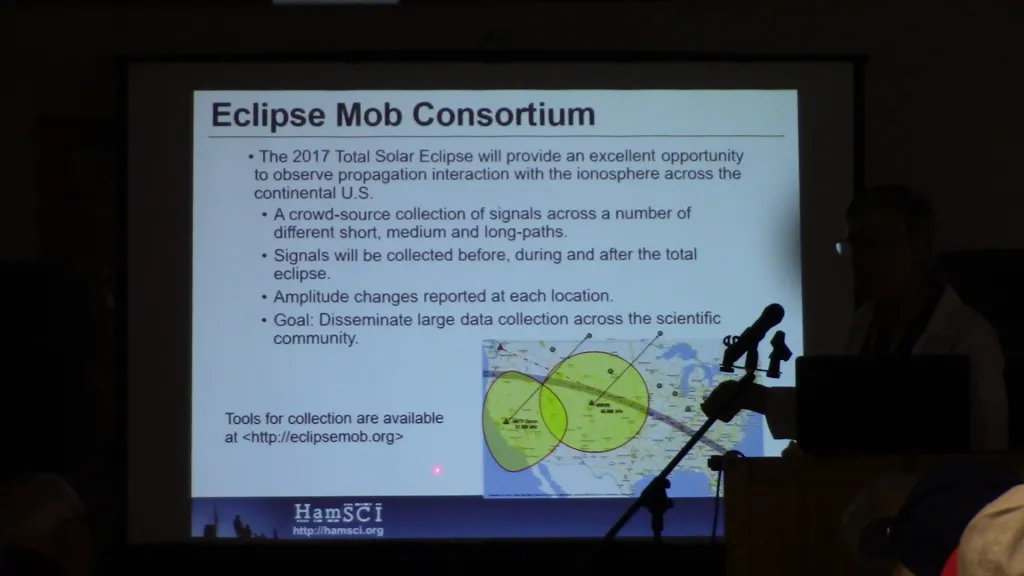
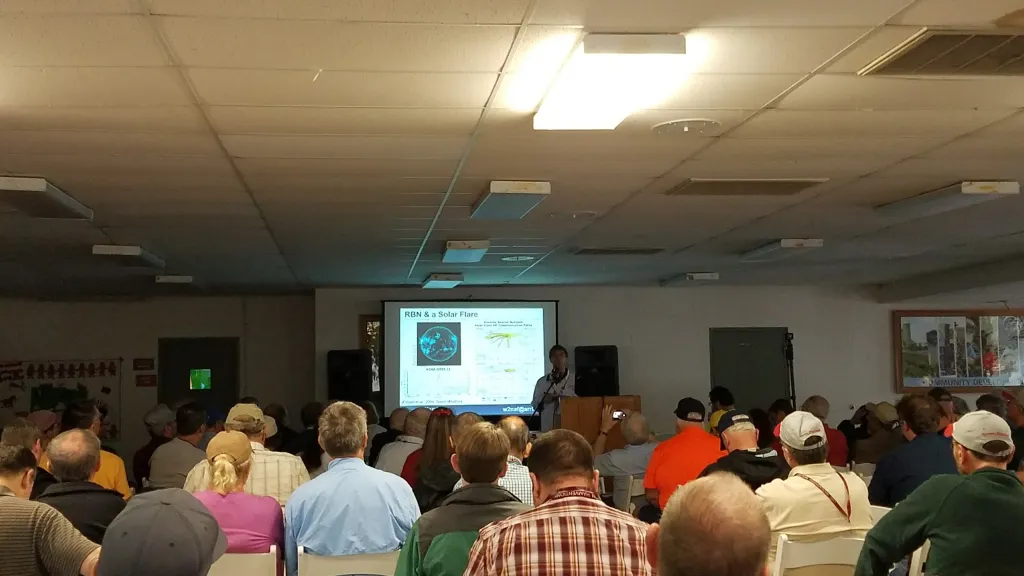
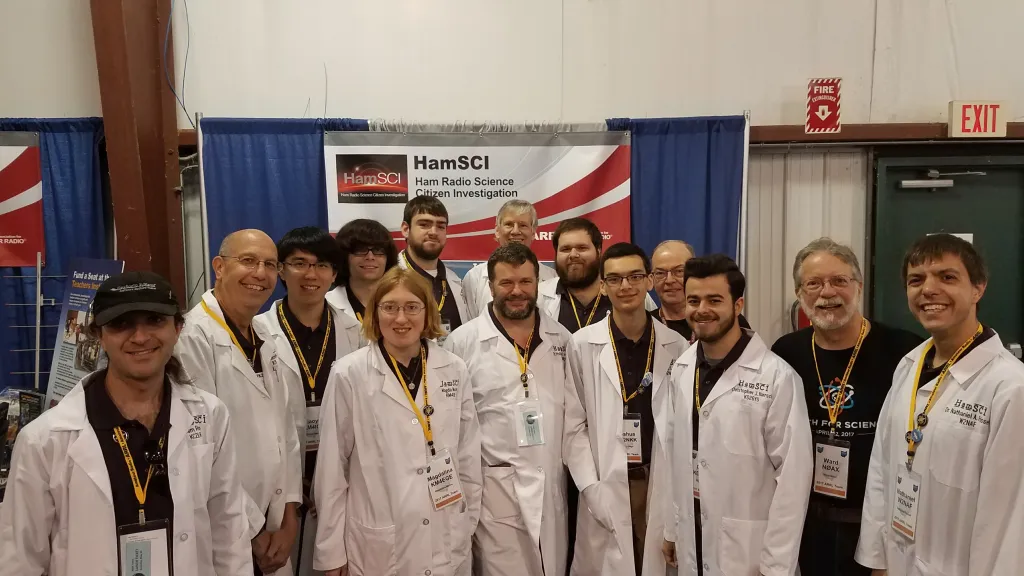
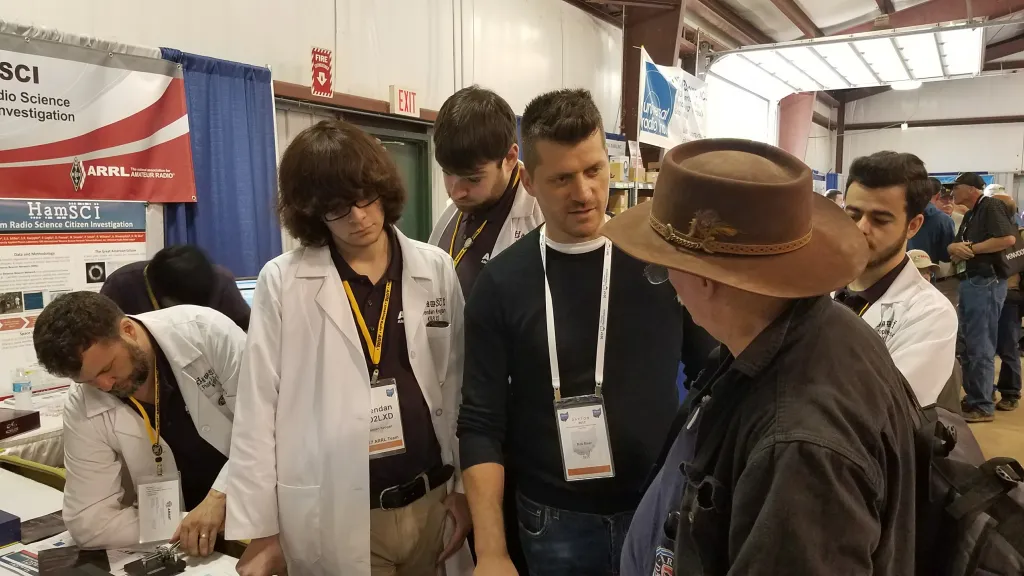
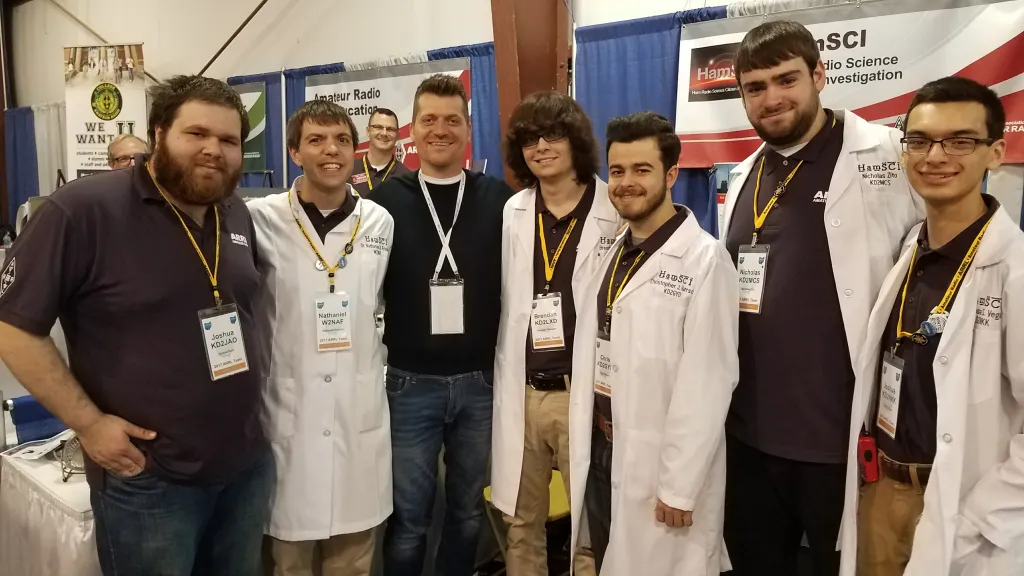
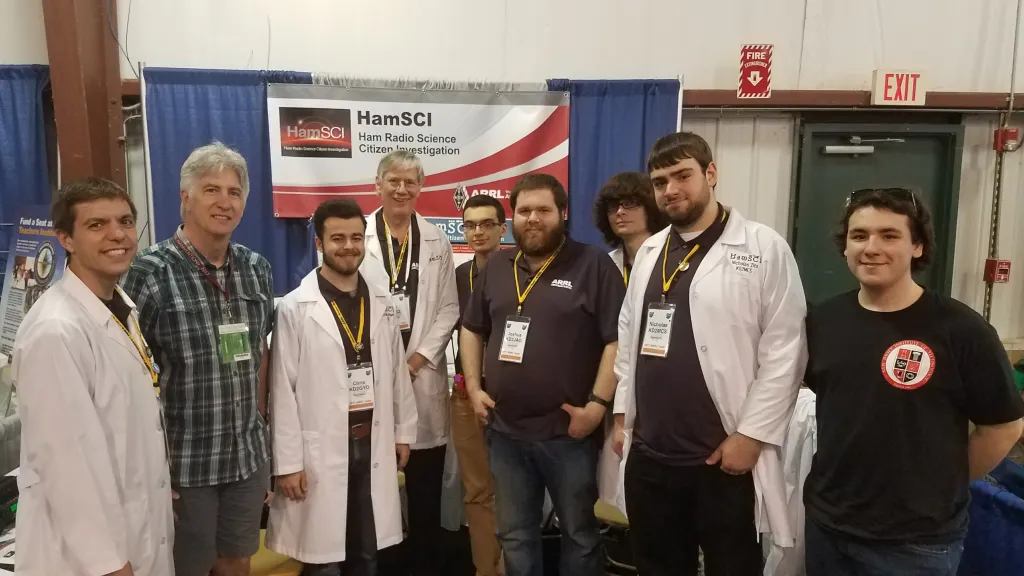
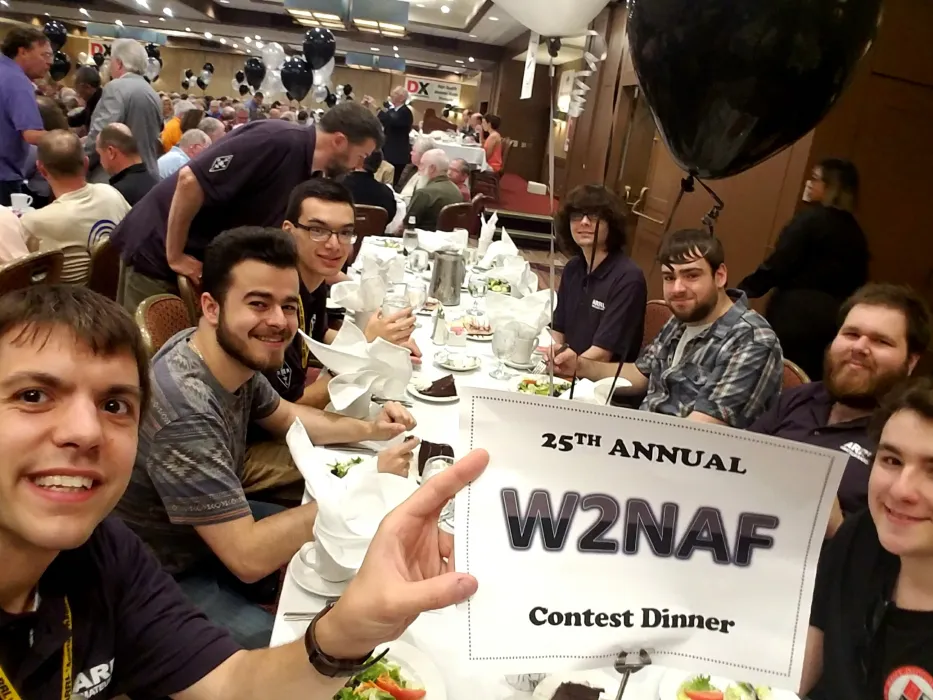
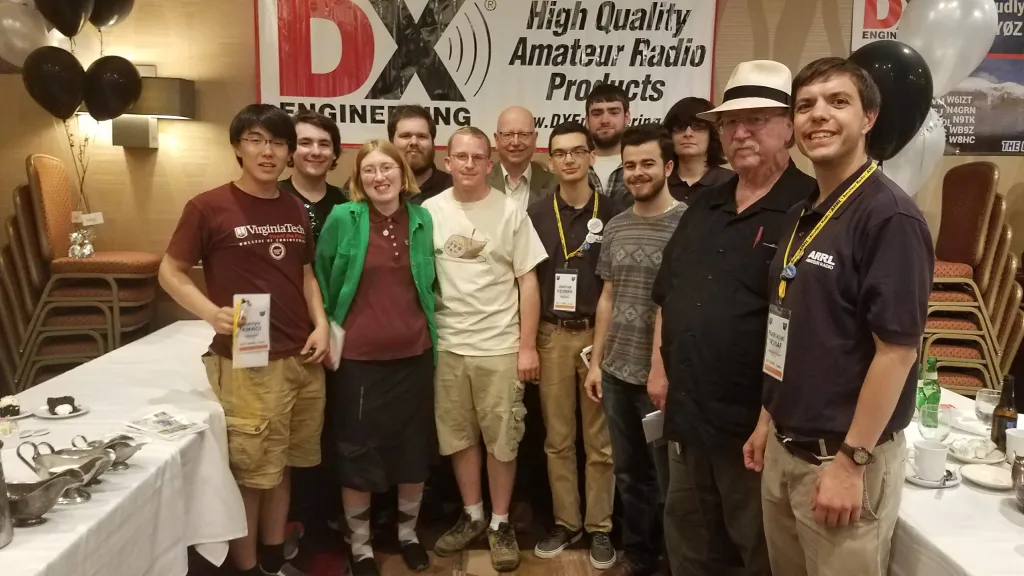
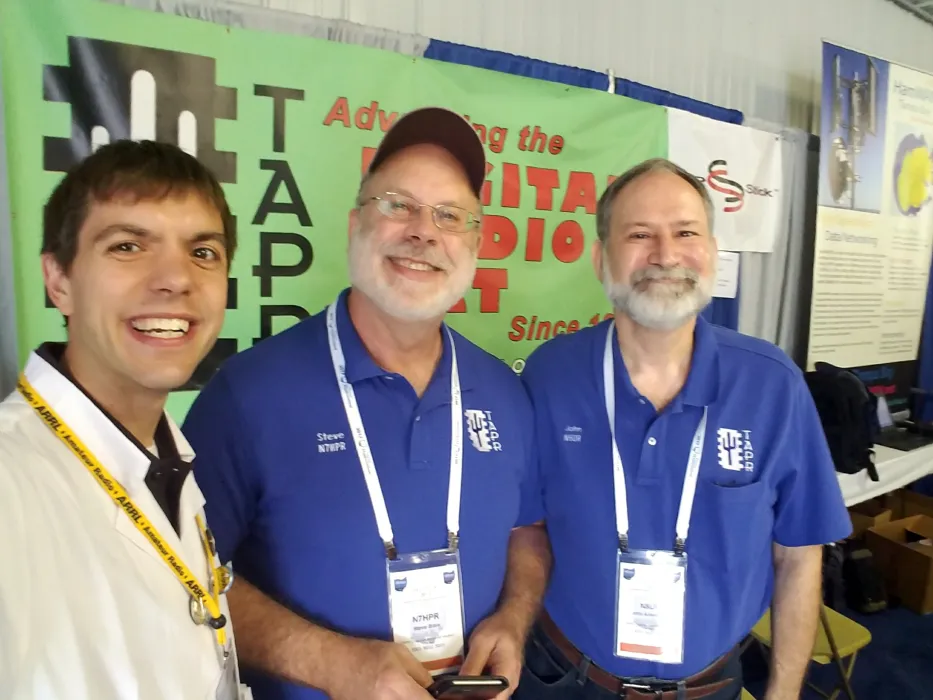
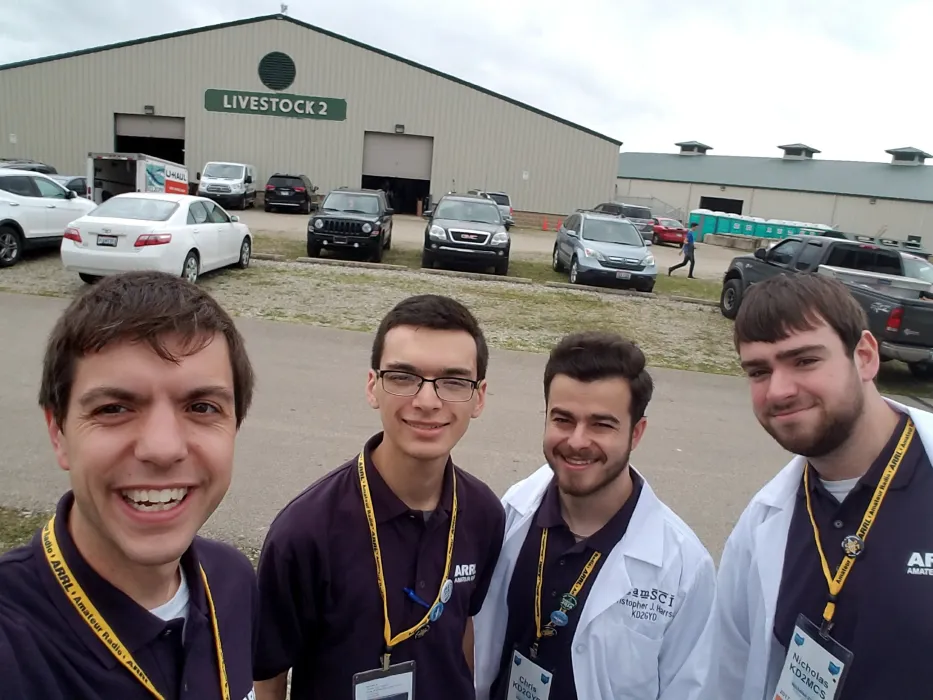
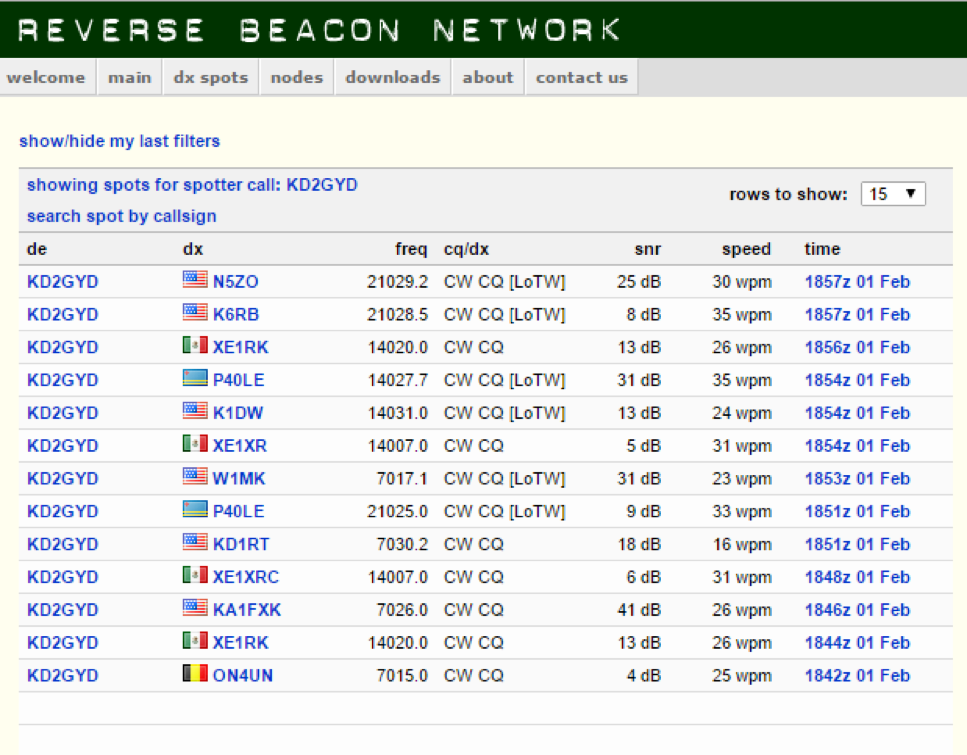
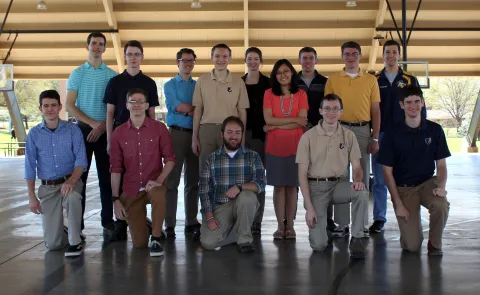
      The HamSCI team completed a successful weekend presenting at the 2017 Dayton Hamvention in Xenia, Ohio. From May 19-21, the HamSCI team ran a booth in the ARRL Expo area where they discussed the HamSCI mission, upcoming experiments, and ways ham radio operators could participate in HamSCI activities. The HamSCI team included members from the New Jersey Institute of TechnologyVirginia Tech, the MIT Haystack Observatory, and Citizen Scientists from the general amateur radio community. This includes the upcoming Solar Eclipse QSO Party (SEQP), participation in the EclipseMob Project, and a live demonstration of both Red Pitaya and Rabbit S-9C based Reverse Beacon Network receive nodes. On Saturday morning, HamSCI presented an ARRL-sponsored forum where members gave oral presentations about HamSCI research and activities. Photos, videos of the presentations, and PDFs of presentation slides are included in this post.


      HamSCI Forum


      Saturday, 9:15 a.m. - 10:30 a.m. – Room 4 (175 cap.)
      Moderator: Ward Silver, N0AX

      1. “What is HamSCI?”

      By Nathaniel Frissell, W2NAF (NJIT-CSTR)

      Video of Presentation

      PDF of Presentation Slides

      A brief overview of HamSCI’s mission, people, and projects are presented.

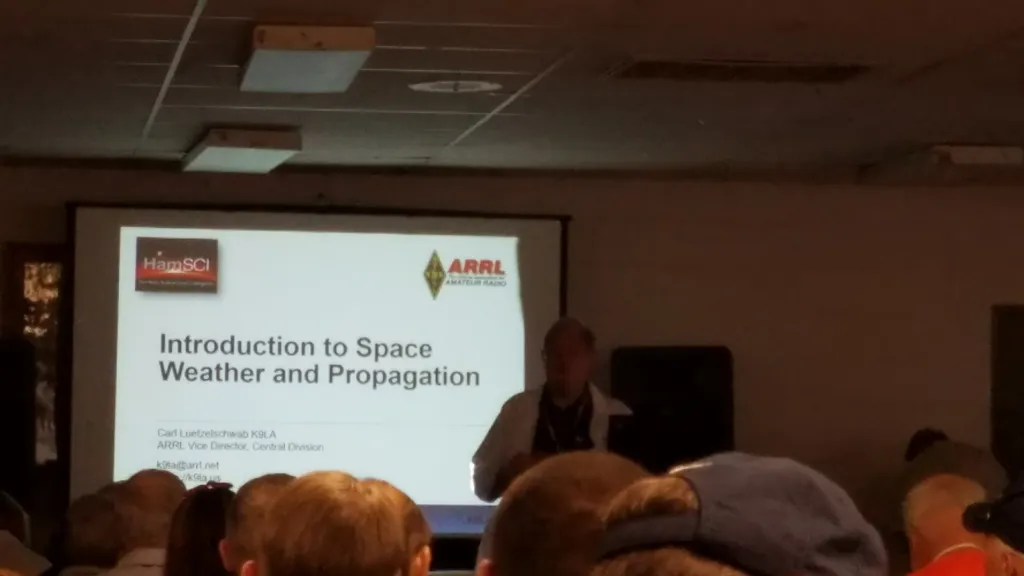
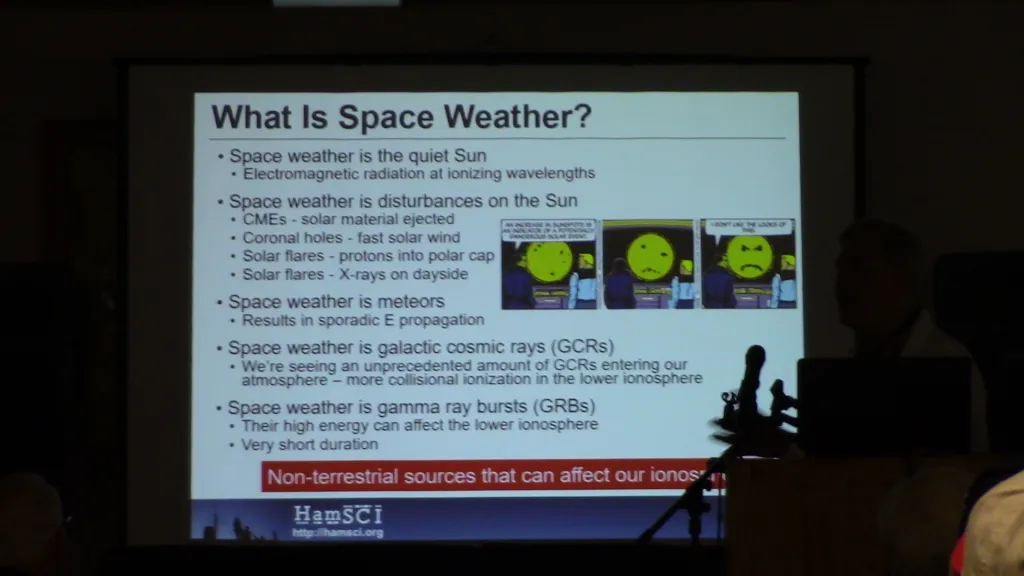
      2. "Introduction to Space Weather and Radio Propagation”

      By Carl Luetzelschwab, K9LA

      Video of Presentation

      PDF of Presentation Slides

      A broad overview of space weather and the effects on propagation is presented, including a review of general band characteristics, and a discussion of expectations for the bands during the 2017 Total Solar Eclipse.

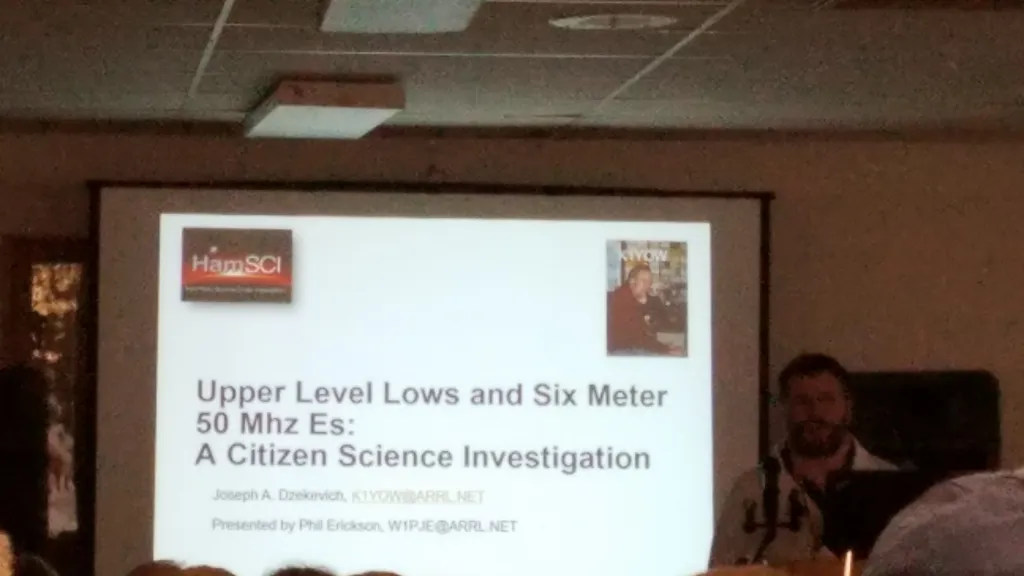
      3. “Upper Level Lows and Six Meter 50 Mhz Sporadic E”

      By Joe Dzekevich, K1YOW, presented by Phil Erickson, W1PJE (MIT Haystack Observatory)

      Video of Presentation

      PDF of Presentation Slides

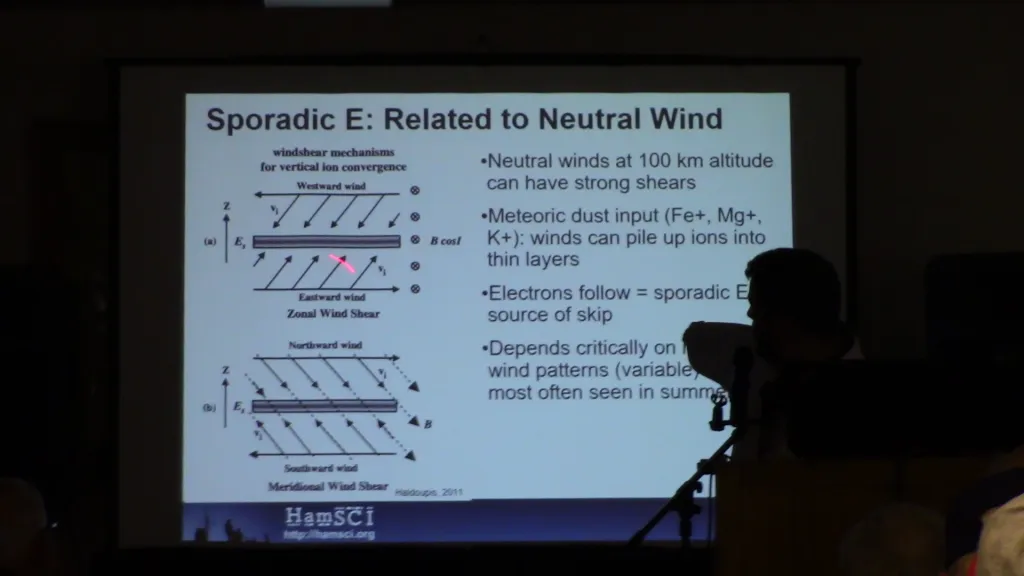
      Amateur radio is used to explore possible correlations between weather storm systems and sporadic E clouds to see if they are collocated. While some of the main causes of sporadic E propagation are wind shear, meteor strikes and upper atmospheric tides (ultimately coming from solar EUV energy inputs), radio operators have noticed that sporadic E propagation is also changed significantly by hurricanes and storms.  Specific cases where K1YOW used amateur radio to investigate the effects of low pressure weather storms on the formation and/or enhancement of 6 meter sporadic E clouds are presented. DX Maps and earth wide weather model charts combined with operations on 6 meters are used to examine possible correlations between the location of the sporadic E clouds and the low pressure weather storm systems.  Initial findings show a high degree of correlation when magnetic field strength is taken into consideration.  

      4. “Ionospheric Impacts of the 2017 Total Solar Eclipse”

      By Magda Moses, KM4EGE (Space@Virginia Tech)

      Video of Presentation

      PDF of Presentation Slides

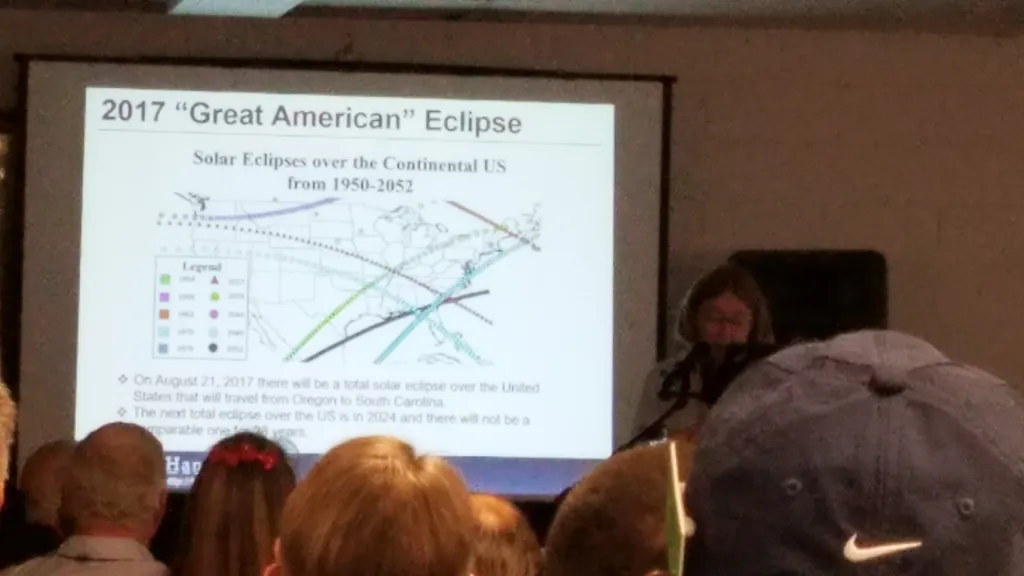
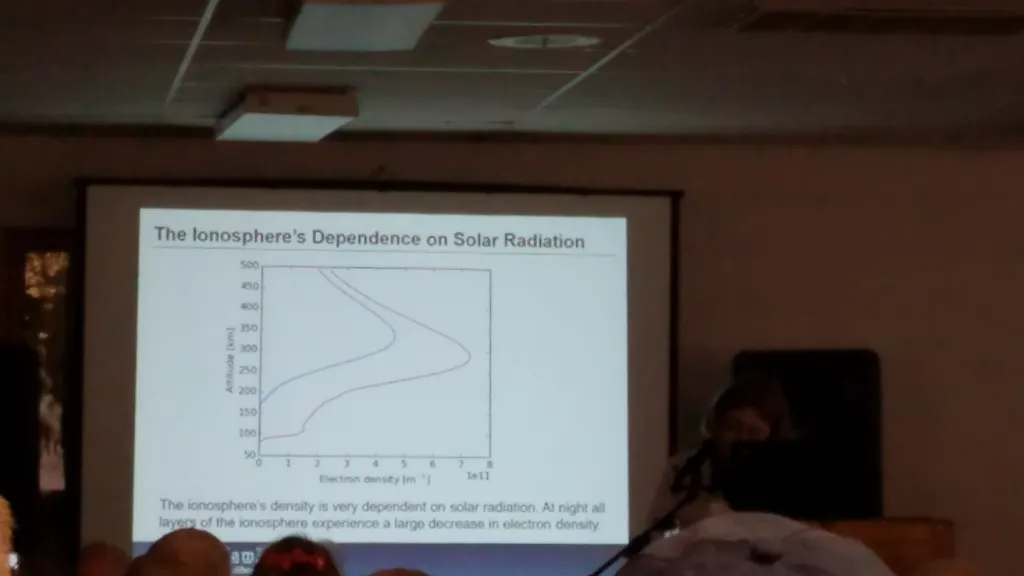
      On August 21, there will be a total solar eclipse over the United States traveling from Oregon to South Carolina. There are significant differences between the conditions during a solar eclipse and the conditions normally experienced at sunset and sunrise, including the east-west motion of the eclipse terminator, the speed of the transition, and the continued visibility of the corona throughout the eclipse interval. Hence, unique ionospheric effects are produced during over the partial and total phases of the eclipse, reflected by changes in radio propagation. These include variations in the density and altitude of the F2 peak leading to changes in the Maximum Usable Frequency (MUF) and the path length of HF signals among others. Analysis of eclipse RF propagation data with raytracing algorithms will shed light on the underlying processes governing the ionosphere. 

      5. “VLF/LF and the 2017 Total Solar Eclipse”

      By Bill Liles, NQ6Z

      Video of Presentation

      PDF of Presentation Slides

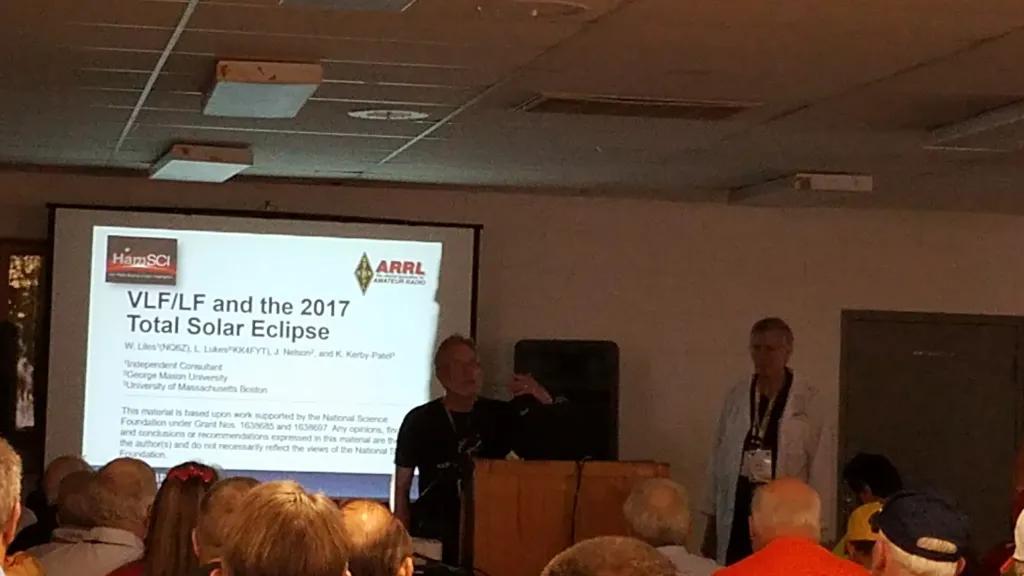
      Previous solar eclipse studies have observed different propagation effects at VLF/LF frequencies (3-300 kHz) compared with those observed at HF (3-30 MHz) frequencies. These differences are primarily due to the much longer wavelengths at lower frequencies in concert with ionospheric D layer interactions. To better understand the unusual eclipse-induced effects at VLF/LF frequencies, we present EclipseMob, a crowdsourced collection effort that will use smart phones as simple VLF/LF software defined radio (SDR) receivers to record changes in propagation from known transmitters during the 2017 Total Solar Eclipse.

      6. “The Solar Eclipse QSO Party: Ionospheric Sounding Using Ham Radio QSOs”

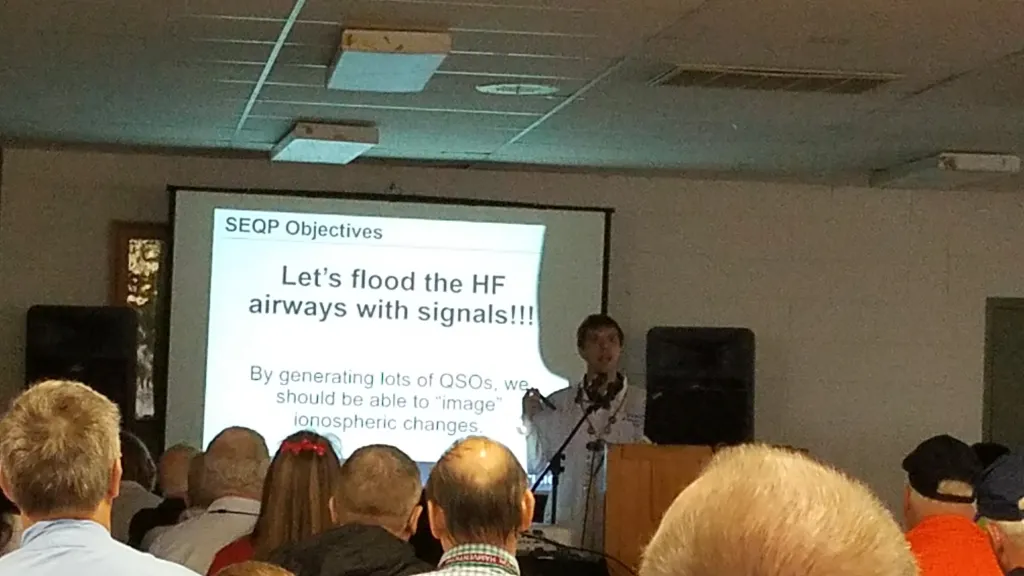
      By Nathaniel Frissell, W2NAF (NJIT-CSTR)

      Video of Presentation

      PDF of Presentation Slides

      The 2017 Total Solar Eclipse is expected to temporarily induce profound changes on ionospheric structure, dynamics, and radio propagation. The ARRL and HamSCI are sponsoring a Solar Eclipse QSO Party (SEQP) that will be used to generate to assist in imaging ionospheric changes before, during, and after the eclipse. Data will be collected through participant submitted logs and the use of automated tools such as the Reverse Beacon Network (RBN), PSKReporter, and WSPRNet. SEQP rules and a prediction of results will be presented.


      2017 HamSCI Hamvention Booth Representatives

      1. Nathaniel Frissell, W2NAF, NJIT
      2. Josh Katz, KD2JAO, NJIT
      3. Brendan Keogan, KD2LXD, NJIT
      4. Josh Vega, KD2NKK, NJIT
      5. Chris Harrsch, KD2GYD, NJIT
      6. Nick Zito, KD2MCS, NJIT
      7. Magda Moses, KM4EGE, Virginia Tech
      8. Harry Han, KM4ICI, Virginia Tech
      9. Phil Erickson, W1PJE, MIT Haystack Observatory
      10. Carl Luetzelschwab, K9LA, ARRL
      11. Ward Silver, N0AX, ARRL
      12. Bob Gerzoff, WK2Y, Citizen Scientist
      13. Bill Liles, NQ6Z, Citizen Scientist

      NQ6Z Wins Best Paper Award at IES 2017

      HamSCI member Bill Liles, NQ6Z, won the Best Paper Award at the 15th International Ionospheric Effects Symposium (IES2017) for his paper On the use of solar eclipses to study the ionosphereIES2017 was held in Alexandria, Virginia from May 9 - 11, 2017 and had the theme "Bridging the gap between applications and research involving ionospheric and space weather disciplines". Bill's paper includes a review of previous eclipse ionospheric findings and an overview of the efforts to study the August 21, 2017 Total Solar Eclipse. Bill's paper is co-authored with Cathryn Mitchell (M0IBG), Mark Cohen, Greg Earle (W4GDE), Nathaniel Frissell (W2NAF), K. Kirby-Patel, Laura Lukes (KK4FYT), Ethan Miller (K8GU), Magda Moses (KM4EGE), J. Nelson, and J. Rockway.

      Read the full paper here.

      HamSCI at the 2017 Dayton Hamvention

      Thanks to sponsorship by the American Radio Relay League, HamSCI will be a part of the 2017 Dayton Hamvention from May 19-21, 2017 at the Greene County Fairgrounds in Xenia, Ohio. Throughout the entire Hamvention, HamSCI members from the New Jersey Institute of Technology, Virginia Tech, the MIT Haystack Observatory, and Citizen Scientists from the general amateur radio community will be at the HamSCI booth in the ARRL EXPO area in Building 2 to discuss HamSCI programs, activities, and mission. The 2017 Total Solar Eclipse and Solar Eclipse QSO Party (SEQP) of August 21, 2017 will be among the most discussed topics at this year’s HamSCI Hamvention Booth. Other topics include using RBN, WSPRNet, and PSKReporter for space weather research and a demonstration of how to operate a Reverse Beacon Network receiver.

      In addition to the HamSCI booth in the ARRL EXPO area, there will also be an ARRL-sponsored HamSCI forum on Saturday, May 20, 2017 from 9:15 A.M. – 10:30 AM in Room 4. During the forum, panelists will share information about professional research programs supported by radio amateurs. Abstracts for this forum are listed at the end of this article.

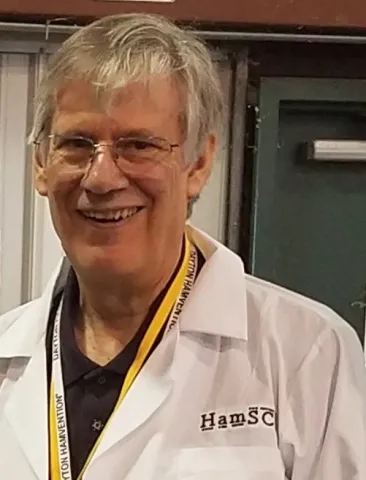
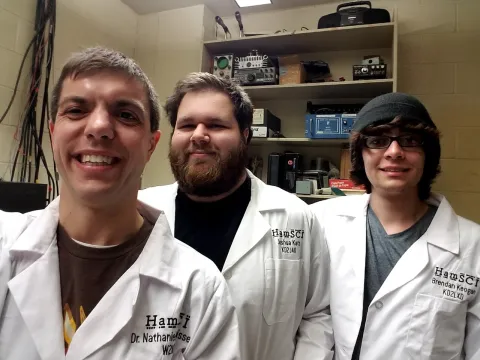
      HamSCi members will be easy to spot during the Hamvention… just look for the distinctive white HamSCI Labcoats!


      HamSCI Forum Abstracts

      Saturday, 9:15 a.m. - 10:30 a.m. – Room 4 (175 cap.)
      Moderator: Ward Silver, N0AX

      1. “What is HamSCI?”

      By Nathaniel Frissell, W2NAF (NJIT-CSTR)

      A brief overview of HamSCI’s mission, people, and projects are presented.

      2. "Introduction to Space Weather and Radio Propagation”

      By Carl Luetzelschwab, K9LA

      A broad overview of space weather and the effects on propagation is presented, including a review of general band characteristics, and a discussion of expectations for the bands during the 2017 Total Solar Eclipse.

      3. “Upper Level Lows and Six Meter 50 Mhz Sporadic E”

      By Joe Dzekevich, K1YOW, presented by Phil Erickson, W1PJE (MIT Haystack Observatory)

      Amateur radio is used to explore possible correlations between weather storm systems and sporadic E clouds to see if they are collocated. While some of the main causes of sporadic E propagation are wind shear, meteor strikes and upper atmospheric tides (ultimately coming from solar EUV energy inputs), radio operators have noticed that sporadic E propagation is also changed significantly by hurricanes and storms.  Specific cases where K1YOW used amateur radio to investigate the effects of low pressure weather storms on the formation and/or enhancement of 6 meter sporadic E clouds are presented. DX Maps and earth wide weather model charts combined with operations on 6 meters are used to examine possible correlations between the location of the sporadic E clouds and the low pressure weather storm systems.  Initial findings show a high degree of correlation when magnetic field strength is taken into consideration.  

      4. “Ionospheric Impacts of the 2017 Total Solar Eclipse”

      By Magda Moses, KM4EGE (Space@Virginia Tech)

      On August 21, there will be a total solar eclipse over the United States traveling from Oregon to South Carolina. There are significant differences between the conditions during a solar eclipse and the conditions normally experienced at sunset and sunrise, including the east-west motion of the eclipse terminator, the speed of the transition, and the continued visibility of the corona throughout the eclipse interval. Hence, unique ionospheric effects are produced during over the partial and total phases of the eclipse, reflected by changes in radio propagation. These include variations in the density and altitude of the F2 peak leading to changes in the Maximum Usable Frequency (MUF) and the path length of HF signals among others. Analysis of eclipse RF propagation data with raytracing algorithms will shed light on the underlying processes governing the ionosphere. 

      5. “VLF/LF and the 2017 Total Solar Eclipse”

      By Bill Liles, NQ6Z

      Previous solar eclipse studies have observed different propagation effects at VLF/LF frequencies (3-300 kHz) compared with those observed at HF (3-30 MHz) frequencies. These differences are primarily due to the much longer wavelengths at lower frequencies in concert with ionospheric D layer interactions. To better understand the unusual eclipse-induced effects at VLF/LF frequencies, we present EclipseMob, a crowdsourced collection effort that will use smart phones as simple VLF/LF software defined radio (SDR) receivers to record changes in propagation from known transmitters during the 2017 Total Solar Eclipse.

      6. “The Solar Eclipse QSO Party: Ionospheric Sounding Using Ham Radio QSOs”

      By Nathaniel Frissell, W2NAF (NJIT-CSTR)

      The 2017 Total Solar Eclipse is expected to temporarily induce profound changes on ionospheric structure, dynamics, and radio propagation. The ARRL and HamSCI are sponsoring a Solar Eclipse QSO Party (SEQP) that will be used to generate to assist in imaging ionospheric changes before, during, and after the eclipse. Data will be collected through participant submitted logs and the use of automated tools such as the Reverse Beacon Network (RBN), PSKReporter, and WSPRNet. SEQP rules and a prediction of results will be presented.


      2017 HamSCI Hamvention Booth Representatives

      1. Nathaniel Frissell, W2NAF, NJIT
      2. Josh Katz, KD2JAO, NJIT
      3. Brendan Keogan, KD2LXD, NJIT
      4. Josh Vega, KD2NKK, NJIT
      5. Chris Harrsch, KD2GYD, NJIT
      6. Nick Zito, KD2MCS, NJIT
      7. Magda Moses, KM4EGE, Virginia Tech
      8. Harry Han, KM4ICI, Virginia Tech
      9. Phil Erickson, W1PJE, MIT Haystack Observatory
      10. Carl Luetzelschwab, K9LA, ARRL
      11. Ward Silver, N0AX, ARRL
      12. Bob Gerzoff, WK2Y, Citizen Scientist
      13. Bill Liles, NQ6Z, Citizen Scientist

      CW Reverse Beacon Network How-To Guide

      This guide has been written from the experience of installing the NJIT K2MFF RBN Receivers in Hope, NJ along with input from the amateur radio community. Our goal is to provide a clear, yet useful guide to installing a modest multi-band RBN Receive Node. Please send questions or comments to [email protected].

      A Guide for Creating a 6-Band RBN Receiver and I/Q Recorder Using a Red Pitaya

      Part 1: Major Equipment

      Antenna

      An active broadband receive antenna is a suitable choice for a modest multi-band RBN receive station. Ideally, this antenna should be able to receive between 1.5-30 MHz and be omni-directional.

      Recommended Antennas:

      Receiver

      A multiband RBN receiver is a HF software defined radio that is capable of listening to multiple bands simultaneously. There are very few reasonably priced receivers with this capability currently available. Some recommendations are listed below.

      Recommended Receivers:

      • Red Pitaya STEMLab
        • We recommend the Red Pitaya because as of this writing (June 6, 2017) it is the only receiver we are aware of that is capable of simultaneous multiband skimming that is readily available for purchase under $500.
        • The Red Pitaya is a development board geared to education and hobbyists, but can also act as a 6-band HF software defined radio with the correct software. Mouser.com is the US-based distributor for Red Pitaya.
        • We recommend purchasing the STEMLab 125-14 Starter Kit with an appropriate case (included with some versions of the Starter Kit).
        • The 10-bit version of the Red Pitaya (STEMLab 125-10) can also serve as a satisfactory skimmer, but it will have less of a dynamic range than the 14-bit version.

      Recommended Receivers with Limited Availability:

      • Rabbit S9-C SDR. This Chinese Receiver is reasonably priced and performs well. Here are the installation page and manual. The software page also contains the S9-C USB driver, .DLL file for HDSDR, and the .DLL file for CW & RTTY Skimmer.
      • QuickSilver QS1R. This has been the staple receiver of the RBN network, but is currently unavailable. It might be possible to obtain one second hand. A separate guide is available for setting up an RBN node using this receiver.

      Other Receivers:

      • While more likely to be used on the air, most FlexRadio SDRs can be used to skim one or more bands. See this guide for details. We urge Flex users who won't be operating the contest to run their radios as skimmers instead.

      Dai Nagakura, JF2IWL, has performed a comparison of the Red Pitaya, Rabbit S9-C, and QuickSilver QS1R receivers as RBN Skimmers. He concludes that all three radios perform well as multiband skimmers if installed properly.

      Preamplifier

      In certain cases, a preamplifier may be needed to improve the performance of the receiver. The typical advice is not to use one unless you have data showing it would be useful. Otherwise it just reduces the dynamic range of the system and does more harm than good, especially if there is a transmitter nearby like most ham stations. An easy and valid test is to listen and connect the antenna.  If you hear any increase in noise with the antenna conected, you have plenty of gain already. The need for a preamplifier can vary as a function of band.

      To check the RF noise level with the Red Pitaya, use the HamLAB PowerSDR software. This will let you use the Red Pitaya as standard software defined radio and listen to and see the RF spectrum anywhere in the Red Pitaya's operating range (0-62.5 MHz). Note that you can have up to two antennas attached to a single Red Pitaya, and assign each slice receiver to a particular antenna.

      Note that the NJIT/K2MMF-2 RBN node appears to be providing satisfactory results with only an ARAV3-1P antenna connected directly to the Red Pitaya with no additional preamplifiers or modifications. Further testing will be done in the future to see if a preamplifier is really needed in this configuration.

      Recommended Premplifier Options:

      Front End Protection

      When installing the RBN Receiver, it is important to make sure that your transmit operations do not damage your RBN receiver, especially the pre-amplifiers. This can be done by:

      Also, active antenna and preamp instructions manuals should provide good guidance with this.

      Part 2: Installing a Red Pitaya 125-14 RBN Node

      Red Pitaya Preparation

      1. Reconfigure attenuation jumpers.
        1. The Red Pitaya inputs are shipped from the factory to place a Low Voltage attenuator immediately after the SMA inputs. This attenuation circuit is a source of noise, and can be bypassed by jumpering pins 2 & 5 as in the photo below. Do this for each input you intend to use as an antenna. See K1TTT's blog for more information.red_pitaya_jumper_config.png
      2. Install the image of Pavel Demin’s SDR Receiver.
        1. Use a computer to extract the contents of Pavel Demin’s SDR Receiver zip image to a blank microSD card.
        2. Insert the SD card into the Red Pitaya while the power is disconnected.
        3. Connect the Red Pitaya to the network, the antenna, and power.
          1. Connect the antenna to the SMA input labeled IN1. For the previously mentioned ARAV-3, you will need an RCA to SMA adapter to connect to the Feedline Voltage Injector directly to the Red Pitaya.
          2. Connect the Ethernet cable to your Red Pitaya and then to your router, switch, etc. Note that the Red Pitaya needs to be provided an IP address. This is typically done by a router on the same subnet as your computer. Connecting the Red Pitaya directly to your computer is generally not sufficient.
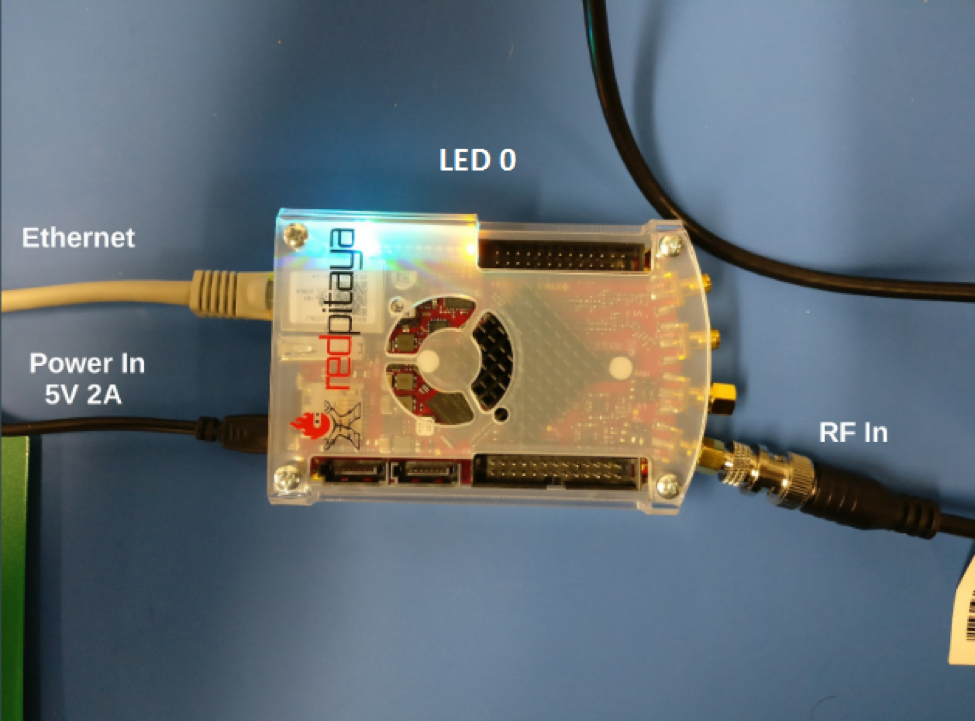
          3. Plug in the power supply from the outlet to the port labeled PWR.

      redpitaya_annotated.png

      Figure 1: Annotate photo of the Red Pitaya STEMLab 125-14.

      CW Skimmer Server Installation

      1. Download and install the CW Skimmer and CW Skimmer Server
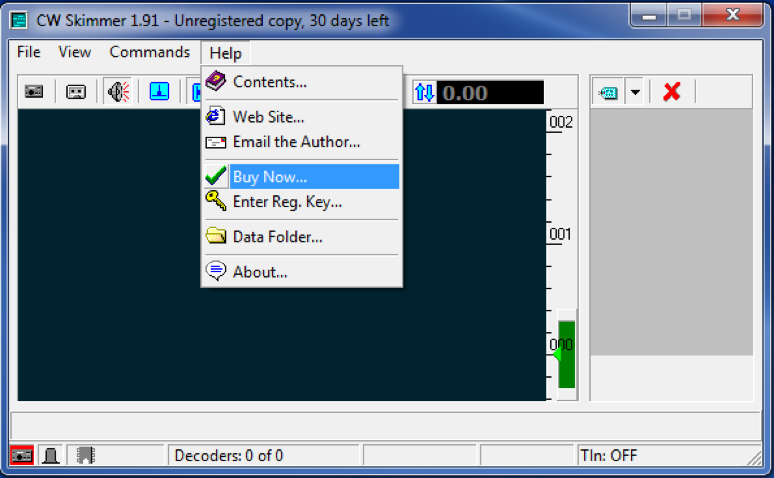
      2. Purchase and register the CW Skimmer and Skimmer Server. The programs will run for 30 days as a free trial. To purchase, launch the CW Skimmer and select Help → Buy Now. Keep in mind that once the CW Skimmer has been registered, the Skimmer Server will also be registered.

      cwskimmer_buynow.png

      Figure 2: "Buy Now..." option of the CW Skimmer program. Note that when you register CW Skimmer, CW Skimmer Server is also automatically registered.

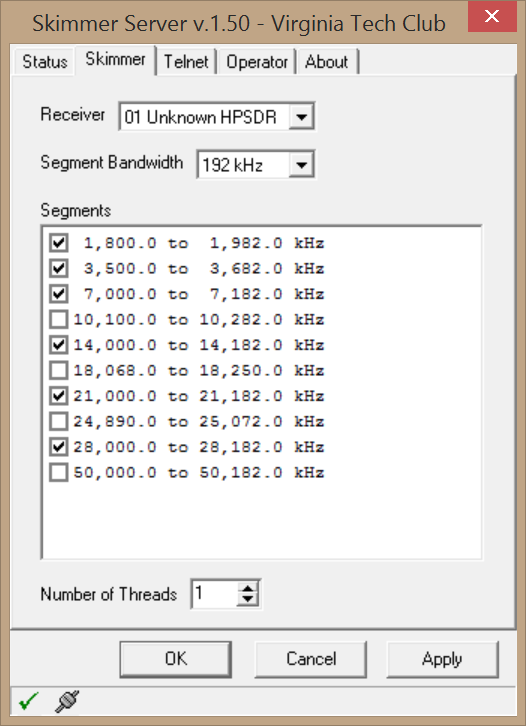
      1. Copy HermesIntf.dll to the skimmer server program directory, located here: “C:\Program Files (x86)\Afreet\SkimSrv\HermesIntf.dll”
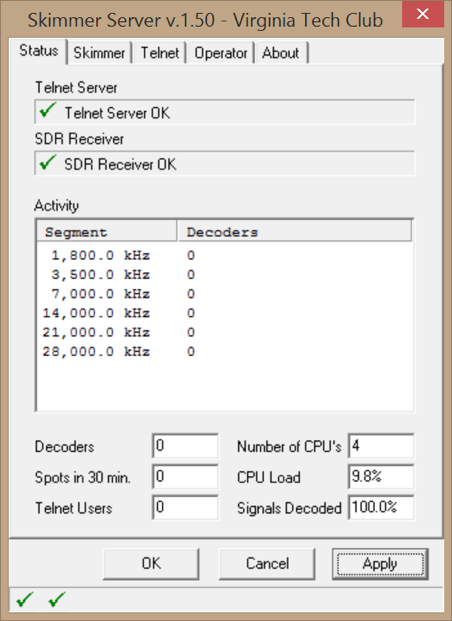
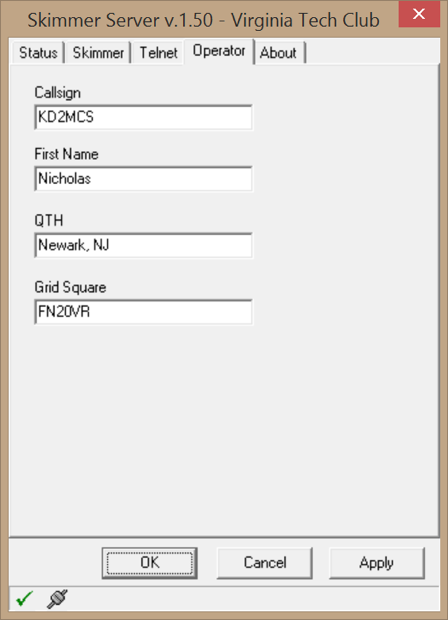
      2. Launch the CW Skimmer Server. The program will automatically minimize to your tray, rather than opening a window. Click on the icon in the tray to open the window. The Skimmer Server should automatically locate your Red Pitaya if it is properly connected to the network; no extra configuration required. The one thing you will have to set is which bands you would like to be skimming so they will properly report your location on the Reverse Beacon Network.

      cwskimmer_settings_status.png

      Figure 3: Status tab of CW Skimmer Server Settings.

      cwskimmer_settings_operator.png

      Figure 4: Operator tab of CW Skimmer Server Settings.

      cwskimmer_settings_skimmer.png

      Figure 5: Skimmer tab of CW Skimmer Server Settings.

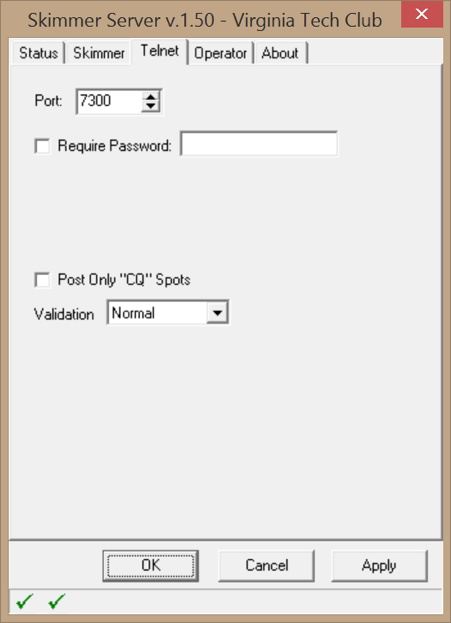
      cwskimmer_settings_telnet.png

      Figure 6: Telnet tab of CW Skimmer Server Settings.

      RBN Aggregator Installation

      1. Install the RBN Aggregator. This program takes the spots from the CW Skimmer Server and sends them to the Reverse Beacon Network. The file provided from the website is the executable program; not an installer. Place the downloaded file in a directory that your computer has write permissions to. An "RBN Aggregator" directory inside of your "Dcouments" directory may be an appropriate choice. Once this is done, launch the executable. Like the CW Skimmer Server, the Aggregator will automatically minimize to your tray, rather than opening a window.
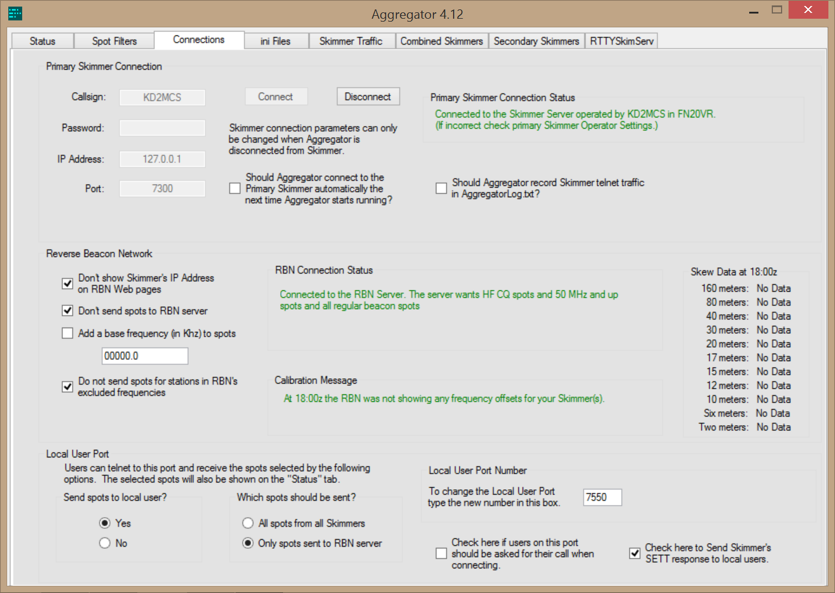
      2. For basic operations: Once the program has been installed properly and opened, there are only two tabs you need to pay attention to. The Status tab and the Connections tab. 
        1. Under the Connections tab:
          1. Enter your desired Call Sign.
          2. Set the password to blank.
          3. Check the box to connect to the RBN as soon as the Aggregator starts.
          4. Make sure you uncheck "Don’t send spots to RBN Server".
          5. Press Connect to connect to the RBN and begin sending spots.
        2. Under the Status tab:
          1. You are looking for green text. Pay attention to Skew Data. If you are seeing red, you may need to calibrate your receiver.
          2. Spots on the right are the ones being sent to the RBN.

      aggregator_connections.png

      Figure 7: RBN Aggregator Connections tab.

      aggregator_skimmer_traffic.png

      Figure 8: RBN Aggregator Skimmer Traffic tab.


      rbn_website.png

      Figure 9: RBN Website showing reported spots from the new RBN Skimmer Node.

      RTTY Skimmer

      Similarly, the Red Pitaya can be used as a RTTY skimmer.

      Recording Raw I/Q Data

      Recordings of digitized RF data are valuable to HamSCI in that they can be analyzed after the contest to reveal signal characteristics that aren't visible in the spots sent to the RBN network. Using the CWSL_Tee library, it is possible to record the raw I/Q data being sent to CW Skimmer Server to files while Skimmer is running. When recording, it is recommended that you install the NTP client to keep the PC's clock synchronized, as this will make the file timestamps as accurate as possible. To install the NTP client, follow the steps in the section "Meinberg NTP Client Installation" under the QS1R Reverse Beacon Network setup guide.

      To configure Skimmer Server to run behind CWSL_Tee, do the following:

      1. Download CWSL_Tee.dll, CWSL_Tee.cfg, and CWSL_File.exe from https://github.com/HrochL/CWSL - look under the 'bin' subdirectory.
      2. At the above link, follow the procedure in the description, labeled "Installation procedure is as follows". Note that while CWSL_Tee.dll and CWSL_Tee.cfg should be placed in the Skimmer Server directory (typically C:\Program Files\Afreet\SkimSrv), CWSL_File.exe should be placed in any folder on the hard drive which will be used to store the recorded data, as this program does not have an option to direct its output files to another folder or drive.
      3. Edit the CWSL_Tee.cfg file such that its two lines are exactly as follows:

        HermesIntf
        64
         
      4. Start CW Skimmer Server. Visible at the top of the "Receiver" option in the Skimmer tab should be a new option, "CWSL_Tee on RP-xxxxxx", where "xxxxxx" are the last 6 digits of the Red Pitaya's MAC address:


        If the selection reads "CWSL_Tee on QuickSilver QS1R" instead, then the edits made to CWSL_Tee.cfg probably did not stick, and CWSL_Tee is attempting to access the interface for a QS1R radio instead of the Red Pitaya.

        Select this option, and click Apply. Skimmer should now be operating normally behind CWSL_Tee.

      Once Skimmer Server is operating through CWSL_Tee, the CWSL_File program is used to record the data from a given band. This program is run via the command line, and records a single band per instance. Therefore, to record every band being skimmed, multiple instances of CWSL_File are run simultaneously.

      Note that CWSL_Tee should not be placed in the C:\Program Files or C:\Program Files (x86) directories - these are not writable without administrator privileges, and attempting to record to these directories will result in no file output.

      Recording a 192KHz band segment was observed to produce slightly under 1MB/s of sustained disk writes. At this rate, recording 6 bands for 24 hours would produce about 375GB of output. It is expected that any modern 1TB or greater hard drive should provide enough write bandwidth to sustain the recording of 6 bands simultaneously for the duration of the event.

      To initiate recording follow the procedure below:

      1. Open a command prompt. Navigate to the directory in which CWSL_File.exe is located.
      2. Run CWSL_File.exe without any arguments to display the usage information. Note the BandNr and Scale Factor arguments - each of these is a single number.

        For the Red Pitaya, the Scale Factor argument should be omitted. The BandNr argument is a number from 0 - 5 representing one of the selected bands. In Skimmer Server,  under the 'Skimmer' tab, band 0 is the first selected band, band 1 is the second, and so forth. This is shown in the screenshot below, in which the red numbers next to the band segment selection panel denote the BandNr that corresponds to each band.

        Additionally, the -L argument should not be used, such that the filenames are generated using UTC times rather than local times. It is recommended that the '-Q' argument is used such that CWSL_File makes a new output file every 15 minutes. This ensures that as many timestamps as possible are recorded during the recording session.


        Note that the screenshot is from a session using a QS1R - the Red Pitaya configuration looks identical aside from one less band being selectable.
         
      3. Start the first recorder, using a command line such as 'cwsl_file 0 -Q'. The output should look like the following:


        The first band is now being recorded. Leave the command prompt in this state until it is time to stop recording, then stop the program via Ctrl-C.
         
      4. Start the remaining five recorders using the above procedure, incrementing the BandNr by 1 for each other recorder. Note that each recorder doesn't need to be in its own folder - the files are named uniquely by band. Below is what a typical recording session will look like:

      After the contest ends, please follow the procedure under the "Uploading to Zenodo" section of the HamSCI Wideband Recording How-To Guide to upload the recordings. As Zenodo has a 50GB limit per data set, please upload the recording for each band as a separate data set where this makes sense. If it is not feasible to upload this much data following the contest, please contact HamSCI so we can make arrangements to get the data via another method.

      Part 3: Community Support

      There are a number of great support communities online for people who operate RBN Receive Nodes and Skimmers.

      • The skimmertalk listserv is for anyone who operates a CW or RTTY skimmer, regardless of whether or not it is connected to the RBN.
      • The RBN-OPS Yahoo group is for people who operate (or intend to operate) a Reverse Beacon Network receive node.

      HamSCI Member Wins Undergraduate Research Grant

      HamSCI member Joshua D. Katz, KD2JAO, was recently announced as a winner of the 2017 NJIT Provost Undergraduate Summer Research award for his research proposal entitled Estimating Ionospheric Parameters Using Real-Time Data Sources. This $3000 grant will allow Mr. Katz to conduct this research at the New Jersey Institute of Technology Center for Solar Terrestrial Research during the upcoming summer, where he develops software solutions to computationally intensive physics problems in the domains of simulation and big data analysis. Mr. Katz's summer research will be supervised by Dr. Nathaniel Frissell, W2NAF, a researcher in the NJIT-CSTR. The proposal abstract is listed below.

      Estimating Ionospheric Parameters Using Real-Time Data Sources

      Submitted by: Joshua D. Katz, KD2JAO
      Research advisor: Nathaniel A. Frissell, W2NAF

      Abstract: The ionosphere is a region of the atmosphere that affects communication, radio propagation, and global navigation systems. This makes understanding and modeling ionospheric structures and dynamics important. Modeling this in real time is difficult because there is a limited set of data sources that can be sampled continuously and in real time. We propose an assimilation process that will enable the incorporation of novel data sources, generated by citizen-scientist activities, into real-time modeling and prediction systems. We will use this data source to generalize a method for calibrating ionospheric models to fit conditions currently being experienced by real radio operators. These data sources are large, historical, and provides a unique coverage that is otherwise absent in traditional sounding technologies. Additionally, these data sources are available in real-time. We propose the development and implementation of an algorithm to best-fit a well-accepted climatological ionospheric model to observations of amateur radio communications. Residuals from the data-model comparison will be used to identify periods of abnormal radio propagation that can then be used in future scientific studies.

      Harvard Amateur Radio Conference

      View Original Eventbrite Article

      Organized by the Harvard Wireless Club, W1AF

      On April 29th, 2017 the Harvard Amateur Radio Symposium (1st edition) will be held in historic Harvard Yard at the center of Harvard University. The symposium will be an opportunity for radio enthusiasts and experts at Harvard, other universities, and beyond to gather to hear speakers present on topics related to amateur radio, both historical and technical in nature. The symposium is being put on by the Harvard Wireless Club, W1AF (HWC), a Harvard owned, run, and sponsored amateur radio society dedicated to the pursuit of amateur radio activity, education, and volunteerism. The HWC has decided to hold this symposium as a means of celebrating our interest in amateur radio as well as to encourage and promote the continuation of the use of amateur radio in the future.

      Speakers:

      • Tom Gallagher, NY2RF
        • CEO, American Radio Relay League (ARRL)
      • Paul Horowitz, W1HFA
        • Author, The Art of Electronics; Founder, SETI
      • James Surprenant, AB1DQ
        • 1st Vice President, Yale University ARC, W1YU
      • Flávio Jorge, CT7AQK
        • Department of Electronics, University of Aveiro, Portugal
      • Fred Hopengarten, K1VR
        • General Counsel, Harvard Wireless Club
      • Cambridge Univ. Wireless Society
        • Via Videoconference Link

      Parking permits can be purchased here.

      University Students Use Balloon with Amateur Radio to Study Eclipse

      By Fleet Belknap, KJ4ZWA

      Bob Jones University, Greenville, SC

      Observable solar eclipses are rare events, and a lot is still unknown about how they interact with earth’s atmosphere.  The August 21, 2017 total solar eclipse will provide a treasure trove of information, as it will take place across the United States.  In order to study the atmosphere during the solar eclipse, NASA is partnering with over 57 teams across the continent to launch balloons that will provide live video of the eclipse. While this looks like an interesting opportunity, it is way too expensive for the average Amateur Radio enthusiast; each team has a budget anywhere from $6,000 to $25,000.

      A group of over 25 students from Greenville, SC are doing something different.  They have developed the Stratos Project.  With a current budget of under $2,000, they plan on sending a live video and scientific data to earth from a balloon at approximately 100,000 feet and inside the path of totality.  Instead of using commercial satellite tracking and communications, they are using Amateur Radio.  The video and some scientific data will be transmitted with an Amateur Television Transmitter (ATV) throughout the flight.  They are planning on using a raspberry pi with a sense hat, GPS, & spectrometer to collect live data throughout the mission.  The payload will also contain a specialized flight data computer to collect humidity, barometric pressure, and temperature as well as other scientific data throughout the flight.  They will be using a low power APRS transmitter to keep track of the payload throughout the flight as well as a foxhunting transmitter as a backup location beacon.

      Fleet Belknap had launched a high-altitude balloon with his freshman engineering class in the fall 2016 semester.  Several other students were greatly intrigued by the idea, and were wishing that they could do it.  In the middle of the conversation, Fleet and his classmate James came up with the idea of doing fundraising and launching a balloon outside of class.  As the group thought about ways that they could make the mission challenging, the subject of the August 21 eclipse came up; and Project Stratos was born.

      The team’s project manager is James Labadorf (KJ4IQS).  He is an Eagle Scout, and has been a licensed HAM operator since 2008.  The team’s lead engineer is Fleet Belknap (KJ4ZWA).  He is a certified Aircraft Electronics Technician (NCATT AET) and has been a HAM since 2011.  They have a combined total of over 14 years of experience in Amateur Radio.

      The team consists of over 25 students with majors ranging from engineering and computer science to pre-med, cinema, and biochemistry.  As with any project, there are many challenges that will need to be overcome by the team.  Among these are the problems of regulating the internal temperature of the payload, payload & camera stability, and consistent communication with the payload.  The Stratos team will be working this summer to overcome these obstacles and use Amateur Radio in the launch to the stratosphere.

      The team is going to be making the event public by live streaming the video on YouTube.  The operating frequencies for the transmitters will be released about a week prior to the launch.  Any reports and/or recordings of the data would be greatly appreciated by the team.

      Regular updates can be found on the team’s Facebook page: https://www.facebook.com/GRVHAB/

      Donations to the project may be made at the team’s GoFundMe page: https://www.gofundme.com/GRVHAB

      They are starting a YouTube Channel at: https://www.youtube.com/channel/UCpSzq41Qt1zjNbXb3Mgfdmg

      The Radio Jove Project and the 2017 Solar Eclipse

      By Dr. Chuck Higgins, Middle Tennessee State University

      Radio Jove is a NASA-affiliated education and outreach project that began in 1999 and gives students, teachers, and other interested individuals a hands-on experience in learning radio astronomy (http://radiojove.gsfc.nasa.gov). Radio Jove is a not-for-profit organization, led by a team of about eight volunteer scientists and engineers, which provides a mechanism to distribute radio telescope education kits and educational resources. Participants may build a simple radio telescope kit, make scientific observations, and interact with professional radio observatories in real-time over the Internet. Dedicated observers can help answer science questions about the nature and characteristics of low frequency radio emissions coming from Jupiter and the Sun, as well as, to understand the variability of Earth’s ionosphere. Radio Jove maintains a data archive to facilitate in the exchange of information and the validation of other ground-based and space-based radio data.

      Due to the nature of its magnetic field, Jupiter emits cyclotron radio wave frequencies below 40 MHz, and more precipitously at lower frequencies. The best frequency range to study Jupiter with ground-based telescopes is above the ionospheric cutoff at about 15 MHz and below 30 MHz. The Sun is also a strong, sporadic non-thermal radio emitter at these frequencies (Figure 1). Because this frequency range overlaps the ham radio bands, Jupiter and solar radio astronomy may be of keen interest to some of the ham radio community.

      Radio Jove HamSCI Fig1.png

      Figure 1. This is a typical type III solar radio burst observed (red line) at 20.1 MHz with a Radio Jove telescope and (blue line) at 22.2 MHz using an ICOM R-75 receiver and a set of two aluminum dipoles. The data are plotted as intensity (antenna temperature, Kelvin) versus time on Dec 24, 2013. [Credit: W. Greenman]

      On August 21, 2017, the Great American Eclipse of 2017 will take place. The moon will pass directly between the Earth and the Sun and the shadow of the moon will follow a path across the continental United States from Oregon to South Carolina. There are many websites describing this amazing phenomenon, and the website https://eclipse2017.nasa.gov provides a great list of general information, eclipse science, observing events, and educator resources.

      Radio Jove is engaging citizen scientists during the 2017 solar eclipse by encouraging them to observe the solar eclipse with radio telescopes. We will enlist and train observers from across the US to help with deployment of the telescopes at different locations along the eclipse path of totality and at other locations receiving a partial eclipse (Figure 2). During the approximately 4-hour event (with totality lasting only ~2.5 min), the 120 km-diameter umbra and the larger penumbra of the moon will sweep across the continental United States. Radio observers will monitor the Sun for solar flares and radio events during the solar eclipse, as well as, observe the galactic radio background (GRB) before, during, and after the eclipse. We will make most observations over a narrow frequency range centered on 20.1 MHz, and several advanced observers will operate spectrographs between 15-30 MHz.
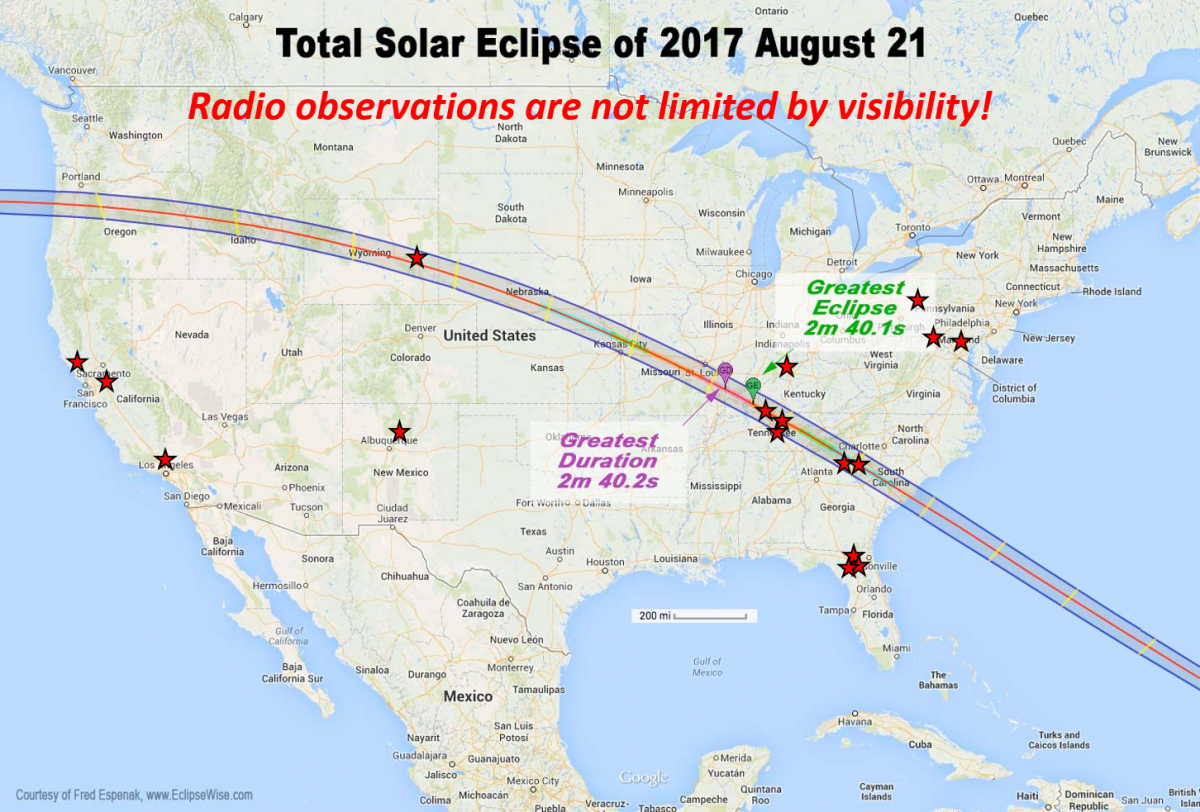
      Radio Jove HamSCI Fig2.png

      Figure 2. Markers indicate planned observation sites for Radio Jove as of February 2017. Radio observations are scientifically useful both inside and outside the path of totality. [Adapted from https://eclipse.gsfc.nasa.gov/SEgoogle/SEgoogle2001/SE2017Aug21Tgoogle.html]

      The passage of the moon directly in front of the Sun from the Earth viewpoint means that the Moon will occult or cut off the Sun’s corona and photosphere over about 4 hours. If a solar radio burst were to occur during the time of the eclipse it is possible that the moon will gradually cover over the coronal source region and provide clues to the exact location of the radio source and how it evolves. Observers at different locations on the Earth would see the occultation happening at different times or perhaps not at all depending on their viewpoint. In addition, the umbral and penumbral shadows will temporarily decrease the ionization levels of the terrestrial ionosphere above, thus causing less absorption of the galactic radio background (GRB) over the eclipsed areas during daylight hours. Thus, the total solar eclipse will offer a unique opportunity to study the response of the terrestrial ionosphere, and perhaps determine the ionospheric (F-peak) electron densities. We will analyze the GRB data collected before, during, and after the eclipse at different portions of the eclipse path and compare it to the baseline data obtained in advance. Prior to the eclipse, observations during the night will enable observers to determine the average GRB under the same celestial configuration as during the eclipse but with no ionospheric absorption by the D layer. The baseline will enable us to infer the changing ionospheric conditions during the eclipse over the different observing locations.

      In summary we plan to use the radio data to: (1) determine whether a solar radio source was occulted or not, and if so, determine the active source location, (2) measure the amount of ionospheric absorption at various locations within the partial and total phases of the eclipse, and (3) characterize the changes in the terrestrial ionization under different local time conditions. We will archive the data and make it available to the public and scientific community.

      For simplicity in hardware setup (portability, cost, reliability, etc.), we will use the basic Radio Jove hardware setup for solar eclipse observations (Figure 3). You can find detailed instructions about the Radio Jove equipment, equipment manuals, and example observations on our website (http://radiojove.gsfc.nasa.gov). Additionally, there are specific Radio Jove solar eclipse observing instructions listed on the website.

      The basic equipment required*:

      • Radio Jove receiver (tuned near 20.1 MHz)
      • 12-volt battery (or 12-volt power supply)
      • Radio Jove antenna dipole (or regular dual-dipole setup, about 30 ft. x 30 ft. of space)
      • Computer (i.e., laptop with battery, external speakers are optional)
      • Radio-Skypipe Software
      • Calibrator (recommended to make the data more scientifically useful)

      * Ham radio operators may also be able to observe the Sun using existing receivers and/or transceivers and antennas, but only if they can defeat the automatic gain control circuit. If you have specific questions about using ham radio equipment for solar observing, you are welcome to contact the Radio Jove group.
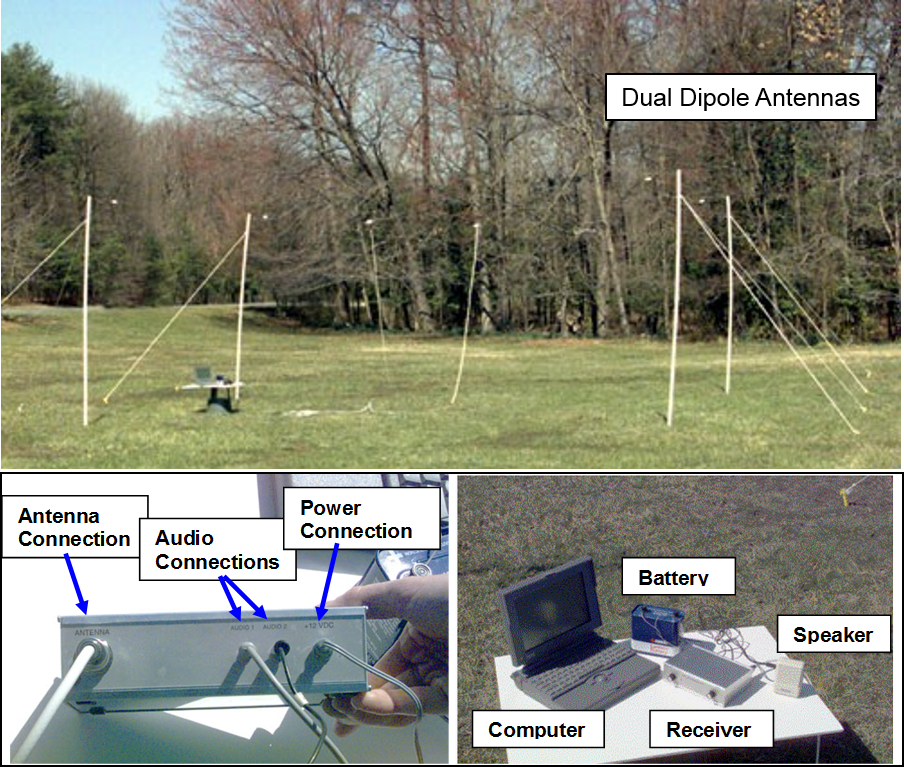
      Radio Jove HamSCI Fig3.png

      Figure 3. (Top) This is an example of a Radio Jove antenna setup with two dipoles. For solar observations, only one dipole is necessary. (Bottom) The receiver connections and the basic equipment needed for a remote setup. [Credit: The Radio Jove Project]

      In general, Radio Jove will always welcome new participants, and we hope that the 2017 solar eclipse will motivate more people to join us. Anyone with a passion for learning can participate in Radio Jove, especially those with some technical skills. Participation can primarily come in 3-4 different ways: (1) buy and build your own Radio Jove receiver and antenna to collect your own Jupiter or solar radio data; (2) use available software, called Radio-Skypipe, to monitor, record, and analyze radio data remotely from another Radio Jove user; (3) download data from the Radio Jove Archive (http://radiojove.org/archive.html); and (4) modify or purchase your own radio equipment to make observations and contribute to the community. Option 2 is particularly useful for schools or people that may not have the space or funding to set up their own telescope. We periodically schedule telecons to help answer questions and foster interactions and data collections during times of predicted Jupiter or solar activity. If you would like more information about our Radio Jove email list, please visit http://radiojove.gsfc.nasa.gov/office/appform.htm.
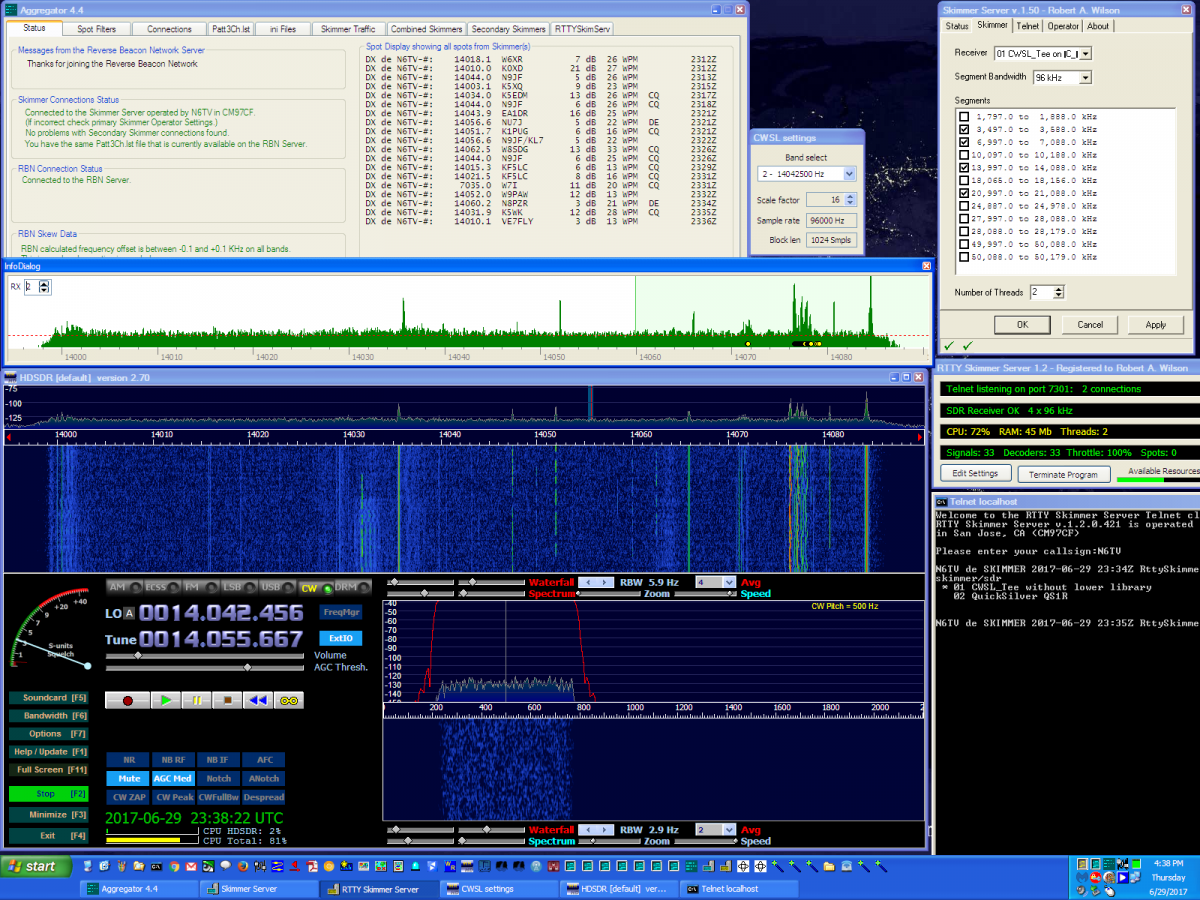
      Solar Eclipse QSO Party (SEQP) Rules for 2017

      Please bookmark this page and join the HamSCI-Eclipse mailing list for further announcements.

      Version 0.75

      19 August 2017

      Date and Time

      21 Aug 2017 1400 – 2200 UTC (Partial eclipse begins at about 1600 UTC in Oregon ends at about 2015 UTC in South Carolina)

      Objective

      To generate observations of propagation by the Reverse Beacon Network (RBN – http://www.reversebeacon.net/), PSKReporter (https://pskreporter.info/), WSPRNet (http://www.wsprnet.org), and event logs before, during, and after the eclipse on the amateur bands for the purpose of ionospheric sounding.

      Bands

      160, 80, 40, 20, 15, 10, and 6 meter bands

      The 60, 30, 17, and 12 meter bands will not be used for scoring purposes because contest QSOs are not allowed there. You may earn bonus points by monitoring non-contest QSOs on these bands with automated receive nodes such as RBN receivers.

      We anticipate plenty of activity. On CW and Phone, tune for stations calling "CQ SEQP" toward the middle and lower portions of the various license class allocations.  Activity on RTTY, PSK, and JT modes will be close to the usual activity centers but - please - spread out!  With many stations active, assist the receiving decoder stations to make accurate and quick measurements by leaving a little space between signals.  You can find band planning information at 

      • http://www.arrl.org/band-plan
      • http://www.ciarc.org/downloads/Digital_Mode_Band_Plan.pdf
      • http://wsprnet.org/drupal/node/218

      Modes

      The SEQP accepts CW, digital (all varieties), and phone QSOs.

      Station Requirements

      • All transmitting and receiving equipment used to make contacts must be no more than 1 km apart.
      • RBN and other automatic receive spotting nodes can be any distance apart.

      Categories (listed separately in the results)

      • Single-operator (one transmitted signal permitted at any time)
      • Multioperator (one transmitted signal per band and mode permitted at any time)

      Exchange

      Call Sign, Signal Report, 6-Character Grid Square

      Example CW Exchange: If NØAX responds to a CQ by W1AW, NØAX receives “NØAX 579 FN31PR W1AW” and sends “W1AW 589 EM48SS NØAX”.

      Notes

      1. On CW, call “CQ CQ TEST DE [your call] [your call] K” using a single code speed during the transmission.  Repetition of CQ and/or TEST as shown, as well as repetition of your callsign, maximizes the ability of the automated receivers to decode and spot your transmission. Please see Getting Spotted by the RBN for tips on calling CQ during the SEQP.
      2. To find and determine your grid square, visit http://www.arrl.org/grid-squares.
      3. Signal Report
        • CW/Phone: The strength (S) value of RS(T) signal reports should represent the approximate peak S meter reading.  (Readings greater than S9 should be sent as S9.)
        • Digital: The preferred digital signal report is the SNR in dB as provided by the digital mode software. Alternatively, give the operator-determined RSQ (Readability - Strength - Quality) value. Note that you can enter SNR values directly into the N1MM+ Snt and Rcv signal report entry boxes directly. Researchers will assume any CW or digital signal report not in three-digit RST/RSQ format is an SNR [dB] value.

      Notes on Digital Modes

      PSK Reporter Spotting

      Many digital mode packages such as the open-source fldigi program and Ham Radio Deluxe/Digital Master 780 have options for automatically sending spots to PSKReporter. Please enable this option to send additional data to PSKReporter.

      JT-Type Digital Modes (Such as WSJT)

      1. Operate normally.
      2. Make sure software is configured with the proper station location information. This is especially important if you are operating portably.
      3. Use an internet connection for time sync and spotting if possible. Smart phone hotspots and public WIFI may provide internet in portable locations.
      4. Use CAT control if possible.
      5. In your Cabrillo soapbox, please note the type and version number of software used e.g. WSJT-X 1.8.0.
      6. ​Optionally sign SEQP to attract other participating operators (e.g., "KV4PC SEQP 73").​

      ​WSPRNet

      Because of the primarily one-way nature of WSPR QSOs, they should not be logged as two-way QSOs in the SEQP.  WSPR reception reports will be logged on WSPRNet (wsprnet.org) and so WSPR operation during the entire SEQP period is encouraged on the usual WSPR frequencies on any band.  In addition, bonuses are offered for operation of WSPR receive nodes as described in the bonus section below. You can further contribute WSPR data to the Eclipse project by recording the full data and sending it to us for post-processing. Please see https://www.scivision.co/wspr-save-raw-wav-data/ for details on saving WSPR data. We ask that upload all data related to the SEQP to the HamSCI community on zenodo.org. Once your data has been posted to Zenodo, you will be provided with a DOI (Digital Object Identifier) that you can include in your SEQP score submission to associate your data with your submitted SEQP log.

      Scoring

      Score = (Multipliers x QSO Points) + Bonus Points

      1. 2 points for CW or Digital; 1 point for phone
      2. Multipliers: 4-character grid squares counted once per band.
      3. Bonus points earned (see Bonus Points section)

      Duplicate contacts on the same band and mode as a previous QSO with a station are allowed after 10 minutes have elapsed since the previous QSO with that station. The same station may be worked on all SEQP bands and modes.

      The final score, including bonuses, will be calculated by the HamSCI data processing team.  Claimed Scores are not required to be accurate.
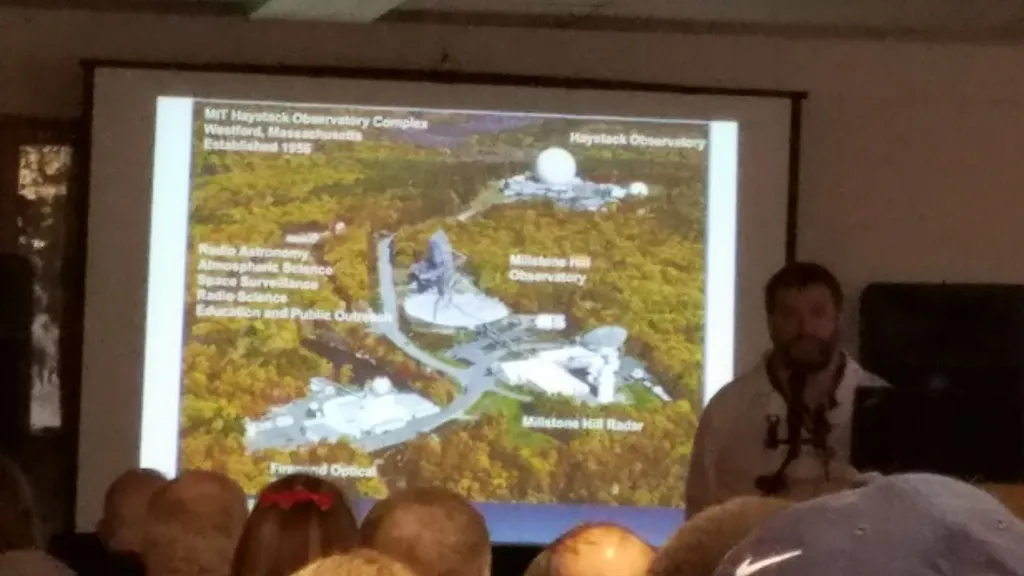
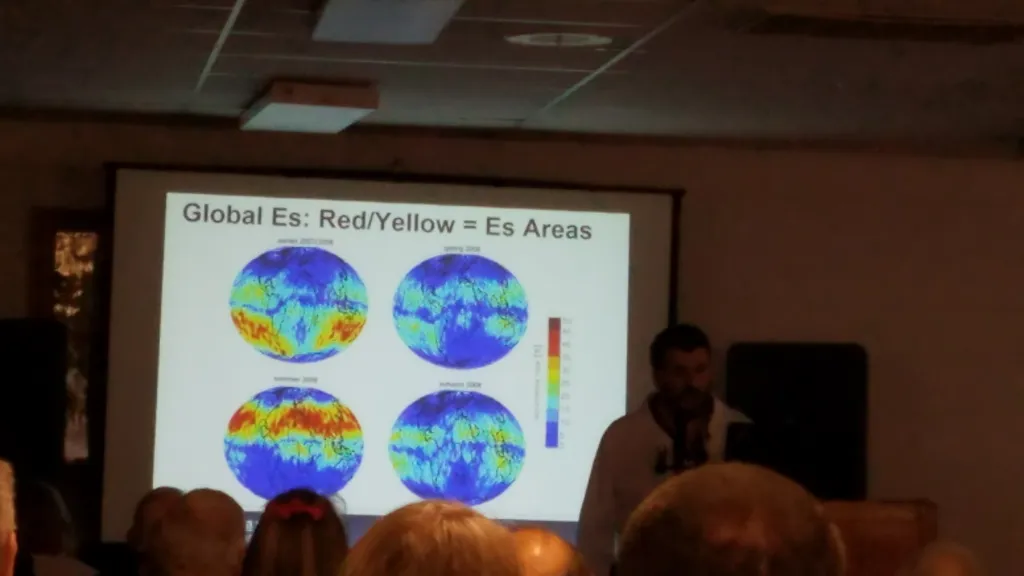
      Logging Requirements

      Frequency, Mode, Date, Time (UTC, not local), Sent Call, Sent Signal Report, Sent Grid, Received Call, Received Signal Report, Received Grid

      Example QSOs (or click here for full example log):

      QSO:  7030 CW 2017-07-20 2241 K2MFF             579  FN20VR N3AO              599  EM97SG 
      QSO:  1816 PH 2017-07-20 2243 K2MFF             59   FN20VR KC2LRC            59   FN13WA 
      QSO:  3590 RY 2017-07-20 2249 K2MFF             599  FN20VR W1AW              599  FN31PR 
      QSO: 14070 PK 2017-07-20 2305 K2MFF             30   FN20VR AD0AE             24   CM97WL 
      
      • Use the following mode codes in the log. N1MM+ should automatically generate logs with the correct codes.
      Mode Cabrillo Code
      LSB/USB/AM PH
      CW CW
      RTTY RY
      PSK31 PK
      JT65 JT
      JT9 JT
      FT8 FT
      • 6-character grid locator is preferred, but 4-character grid locator is acceptable.
      • Include station power level, 6-character grid square, antenna type, equipment list, and extra comments in the log soapbox. Please use the example format for easy post-event processing.

      Example soapbox:

      SOAPBOX: power=100 W, grid=FN20Vt, antenna=dipole, equipment=IC7410,
      SOAPBOX: comments=Totality was beautiful!
      • Use any software that supports the Solar Eclipse QSO Party. The N1MM+ contest logger natively supports the SEQP as log type "ECLIPSE". Any logging software that supports the ARRL VHF contest exchange format can also be used.

      n1mm_seqp_config.png

      Figure: "New Log in Database" dialog box from the N1MM+ contest logging program. Select log type "ECLIPSE", choose "SINGLE-OP" or "MULTI-OP", put your six-character grid square in the Sent Exchange box, and include station data in the soapbox.

      Log and Score Submission

      SEQP Log submission instructions will be available at http://hamsci.org/seqp. Participants who submit through the web interface will immediately receive a downloadable PDF Certificate of Participation.

      1. Please submit logs using the Cabrillo format standard. Paper logs and non-Cabrillo logs may be converted to Cabrillo format using WA7BNM's online Cabrillo form. Cabrillo files will be used for both scoring and research purposes and is the preferred log format.
      2. Participants may alternatively submit ADIF or (other format) logs. These will not be scored but may be used for research purposes.
      3. Any additional supporting files you believe would be useful to research may be posted to the public HamSCI zenodo.org community. You will be provided a DOI (digital object identifier) you can include on the SEQP log submission page.
      4. Logs must be submitted by 2359 UTC Saturday, September 30, 2017.

      Bonus Points

      All bonuses will be calculated after the SEQP and included with the final scores.

      1. Operated during totality (or the time of greatest shadow at your QTH) – add 100 points.
      2. Operate outdoors (so you can see the eclipse) – add 100 points
      3. Operate at a public venue – add 100 points
      4. Provide ground conductivity (estimated from online conductivity maps, see https://www.fcc.gov/media/radio/m3-ground-conductivity-map) – add 50 points.
      5. Upload PDF of antenna and station design characteristics, including information such as orientation, E and H plane patterns, height above ground, station block diagram – add 100 points.
      6. Provide Effective Radiated Power relative to a Dipole (ERPD) on each band – add 50 points per band.
      7. Operate a wideband RBN, PSKReporter, or WSPRNet node during the contest
        1. 50 points per band and mode (including 60, 30, 17, and 12 meters).
        2. Multiple receive sites may be claimed, provided receive sites are spaced at least 100 km apart.
      8. Provide wideband I/Q recordings of SEQP bands (50 points per band). The data files should be uploaded to the HamSCI community on zenodo.org. Follow the procedures on the Eclipse HF Wideband Recording Experiment page for instructions and provide a link to these data files on the SEQP log submission page.
      9. One bonus point will be awarded for each band and clock hour during which your signal was spotted in a grid square other than your own by the RBN, PSKReporter, or DX spotting network. There are eight clock hours and 7 bands available for receiving bonus points. A spot of your signal on any mode will qualify for the bonus point.
      10. Bonus points items will be submitted and claimed via the SEQP Log Upload page. The link to this page will be posted at hamsci.org/seqp by the SEQP date.

      EclipseMob Low Frequency Effort

      By Bill Liles, NQ6Z

      Editor’s Note: The HamSCI-related eclipse efforts comprise of a number of sub-projects. This article describes the EclipseMob project, which is an experiment led by a team at George Mason University and the University of Massachusetts at Boston. EclipseMob will study eclipse-driven ionospheric effects using the Very Low Frequency (VLF) and Low Frequency (LF) bands. Results of this experiment could aid in understanding propagation at the proposed 2,200 meter ham band.

      Since 1912 there have been many efforts to collect and analyze data during a solar eclipse to help understand the ionosphere. These efforts have been conducted in frequencies ranging from VLF to VHF.  In most cases, individuals or small teams have collected data from disparate transmitters.

      EclipseMob is an effort to crowdsource collection of data from a single transmitter at hundreds of spatially diverse receivers, resulting in the largest-ever measurement campaign of ionospheric effects on radio wave propagation during a solar eclipse. This allows us to compare the collections using both geolocation and time.

      The main focus of EclipseMob is collecting amplitude variation data from WWVB, which operates at 60 kHz. A secondary focus is on the U.S. Navy’s VLF and LF transmitters.

      In studying past collections at VLF and LF frequencies, several interesting behaviors were observed.  For example, some reports showed an increase in signal strength, some reported a decrease in signal strength, and some reported a “W”-like pattern with first a decrease, then an increase, then a decrease, then back to the same amplitude as before the eclipse. It is worth noting that all of these experiments were conducted at different receive locations for different transmitters during different eclipses.  We hope that, that with enough spatially diverse collection sites relative to a single fixed transmitter, we can answer the question of why results have varied so significantly in prior experiments.

      eclipsemob_news_fig.jpg

      A plot of the variation in signal strength at 75 kHz (HBG time clock) observed from a variety of locations across Europe. [M. Sanders, 1999]

      Another result that shows up in the literature is the shape of the waveform before, during, and after the eclipse. Most reports show a slow rise in amplitude followed by a much quicker decrease. This could be explained by the time constants associated with recombination in the D layer followed by re-ionization of the D layer. However, not all reports show that shape.  We also hope to address the reason for this discrepancy based upon the spatially diverse collection.

      There are multiple ways to collect the time amplitude data required for these studies.  One can simply use a VLF/LF receiver in which amplitude can be digitized or is already digitized.  One can purchase a SuperSid receiver from http://radio-astronomy.org/node/210 ($48).

      Or one can build the receiver shown on the EclipseMob website (EclipseMob.org).  This is a simple receiver, composed of only one chip and a few other components.  The output is fed into the microphone jack of an Andoid smartphone that runs an app to digitize the signals and add location and time information.

      Since this effort is a passive collection, folks can collect this data while still taking part in other solar eclipse activities such as the Eclipse QSO Party. Additionally, an amateur radio license is not required for collecting EclipseMob data.

      The EclipseMob project is a joint effort of many people.  The leadership team includes:

      • Laura Lukes, KK4FYT, George Mason University
      • Jill Nelson, George Mason University
      • KC Kerby-Patel, University of Mass at Boston
      • Bill Liles, NQ6Z

      With support from

      • Morris Cohen, Georgia Tech
      • John Rockway, U.S. Navy SPAWAR

      Solar Eclipse QSO Party 2017

      SEQP Logo

      On August 21, 2017, a total solar eclipse caused the shadow of the moon to traverse the U.S. from Oregon to South Carolina in just over 90 minutes, causing dramatic changes in both the ionosphere and HF propagation. The Solar Eclipse QSO Party (SEQP) was a HamSCI-ARRL sponsored operating event to generate data to study ionospheric changes during the eclipse. Not a ham radio operator yet? Learn more about it from the American Radio Relay League.


      SEQP Rules

      Science Results

      • Initial SEQP Science Results using RBN data have been published by Frissell et al. (2018) in Geophysical Research Letters. The figures below are excerpts from the paper, showing RBN spot coverage during the SEQP and propapagtion effects relative to maximum eclipse time on the 1.8, 3.5, 7, and 14 MHz bands.

      map.png

      eclipse.png

      SEQP Data and Software

      Contest Results

      The results are in! Congratulations to the top single operators, multi-operators, and RBN recievers. The SEQP was scored by W2NAF and K2AEM, with final write-up by N0AX. Thank you to all who participated!

      Full results PDF: Solar Eclipse QSO Party - Full Results - Version 1.1.pdf

      SEQP Winners
        Single Op Total Score Multi-Op Total Score
      1 AA3B
      Bud Trench
      Boyertown, PA
      403,975 W0ECC
      Elayer Contest Club
      St. Charles, MO
      (N0AX, N5OT, & KD0YJN)
      191,625
      2 K4BAI
      John Laney, III
      Columbus, GA
      224,502 W0D
      DeSoto, MO
      (WB0SND & WB0TUA)
      112,553
      3 W1SJ
      Mitchell Stern
      Essex Junction, VT
      180,882 W5GAD
      Jefferson Amateur Radio Club
      Metairie, LA
      (N5LIT, KG5GJT, N5HZ, & NO5W)
      93,651
      Top RBN Receivers - 10,000+ Spots During SEQP
      RBN Call # Spots Operator QTH
      WE9V 54,874 Chad Kurszewski Bristol, WI
      AA4VV 40,574 Thomas Berry

      Lexington, NC

      KU7T 31,762 Andreas Hofmann North Bend, WA
      N4ZR-3 28,692 Pete Smith Phoenix, MD
      NC7J 28,564 Utah Contest Club Layton, UT
      W3OA 28,057 Dick Williams Mooresville, NC
      N2GZ 18,623 Greg Zenger North Stonington, CT
      N0TA 14,751 John Reilly Louisville, CO


      2017 Hamvention SEQP Presentation


      The SEQP was coordinated by Nathaniel Frissell, W2NAF, at the New Jersey Institute for Technology Center for Solar Terrestrial Research (NJIT-CSTR) with support from the National Science Foundation grant AGS-1552188/479505-19C75 and the NJIT-CSTR. Thanks to the many collaborators, including those at Virginia Tech, Montclair State University, the MIT Haystack Observatory, the Johns Hopkins University Applied Physics Laboratory. Special thanks to the American Radio Relay League for publicizing the SEQP and the Reverse Beacon Network and PSKReporter for extra support in data collection.
      njit_50h.jpg nsf_50h.jpg

      Academic and Ham Radio Meeting in Portugal

      On behalf of Flávio Jorge, Chairman and Organizing Committee Member:
       
      The Ether Talks is a radiocommunications congress that takes place at University of Aveiro, Portugal, on Saturday, March 4th 2017. Similarly to the previous editions, on this 3rd edition it is bringing together all the radioelectric sciences enthusiasts, and especially two big communities: the amateur radios community and the academic one.
       
      The first community has usually a long and exhaustive experience operating the radio and on the observation of the radioelectric phenomena, but the theoretical knowledge about the same phenomena is quite limited and of empirical nature. The second, responsible for researching and developing the technology, has naturally deep knowledge about the phenomena, but the experience on operating the equipment and on the field is much reduced. Having said that, both communities complement each other and so the exchange of ideas and experiences is of most interest for both of them. Additionally, to the operators and developers we add the remaining piece: the national regulator (ANACOM).
       
      This year we will have a researcher from the Univeristy of Twente, who also works on the Dutch regulator and who not only is an amateur radio (PE5B) as also represents his country on the ITU (the international regulator) Study Group 3. Prof. Witvliet will bring us the theme Near Vertical Incidence Skywave: Antennas and Propagation and he will show how he employed his amateur radio activity on the professional scientific research.
       
      We also expect to hear Dr. Sinanis from the ITU space communications division, who is an amateur radio with the callsign SV3SJ, and responsible for the ITU amateur radio station whose callsign is 4U1ITU. After presenting the ITU amateur radio activities, and together with ANACOM, we will discuss about the current state of the amateur radios and the future that is envisaged for the community.
       
      Dr. Cupido, after getting a deep professional experience on the field of microwave engineering as a professional working at Instituto de Plasmas e Fusão Nuclear, among others, has now his own company, LC Technologies, and as an amateur radio will give us a lecture on Deep Space Communications. In fact, as an amateur radio he is one of the very few in Portugal and in the world using the Moon as satellite (EME) to communicate, he is an expert on ionospheric propagation and uses many times tracks of meteorites to establish international radiocommunications. Moreover, at home, he does what professional teams are designated for: monitoring and tracking the signals sent by space missions on the deep space as it is the case of the well-known Voyager mission, having received already several contact certificates from NASA.
       
      Finally, Prof. Carvalho, professor at University of Aveiro, IEEE Fellow member and IEEE Distinguished Microwave Lecturer will provide a lecture on Wireless Power Transmission, an emerging technology that we envisage to be the natural way to charge batteries on the future. This is certainly a different way of using the radio and it will bring to the discussion how, from the law point of view, amateur radios can execute similar techniques.
       
      Beyond the lectures of our invited speakers, we encourage the submission of works developed in the framework of radioelectric sciences by all of those that are as much as simple enthusiasts (not necessarily amateur radios, who have to be certified by the correspondent national regulator). In this sense, the best work will awarded with the Michelson-Morley prize.
       
      The last two editions of the Ether Talks were a huge success, beyond all the expectations, therefore we invite you to come to Aveiro and to join us on this event! The Ether Talks is a singular and unique event of its kind in Portugal.
       
      For more information, please see: https://www.facebook.com/conversasdoeter/